RGA Research: U.S. population mortality
Analysis of U.S. population mortality provides valuable insight into emerging mortality trends
Where are we? How did we get here? Where are we going?
Ready to dig deeper? Let’s talk
Read more
Perspectives from RGA experts
A wide range of RGA experts – in underwriting, pricing, risk management, insurance medicine, research and development, and more – have derived insights from this data analysis that they have applied to insured (individual and group life) and annuitant populations. Brief summaries of these insights and their ongoing value to RGA’s work can be found at the link below.
U.S. Annualized Mortality Improvemet
2003 - 2007
2007 - 2011
~2.0%
Individual Life Actuarial “While U.S. individual life mortality is typically thought of as being much lower than general population mortality, population mortality can still help inform assumption setting for insureds in certain areas.” Susan Willeat Vice President and Managing Actuary, Assumptions Lead in U.S. Individual Life
Group Life Actuarial “Given reporting lags associated with group life data, U.S. population mortality data provides early insights into emerging trends in the group life market. Further, cause-of-death data at more granular breakdowns by age and gender are more credible in the larger U.S. population dataset.” Michelle Haines Vice President, Head of Global CAT and Life, Accident & Special Risk Pricing, U.S. Group Reinsurance
Financial Solutions Actuarial “U.S. population mortality experience can help us understand mortality trends and inform assumptions for pensioners.” Emily Dave Actuary in U.S. Longevity Research
Mortality TRENDS “U.S. CDC population death data can serve as a high-quality leading indicator of where insured mortality improvement may be headed.” Jason McKinley Vice President and Actuary, Global Research and Development
Insurance Risk “Insured population mortality and morbidity assumptions need to be set in the context of the wider general population. The trends and changes observed within the wider population provide insights into some of the dynamics that may filter through to the insured population.” Elena Tonkovski Vice President and Senior Actuary, Insurance Risk
2011 - 2015
~0.2%
Post-Pandemic Mortality Trends Explored
A summary look at RGA's in-depth analysis of US mortality data In this brief video, RGA's Micah Canaday, Vice President of Americas Data Solutions, explains how RGA is using CDC population mortality data to derive insights into medium-term and possibly longer-term changes.
CLOSE X
Share:
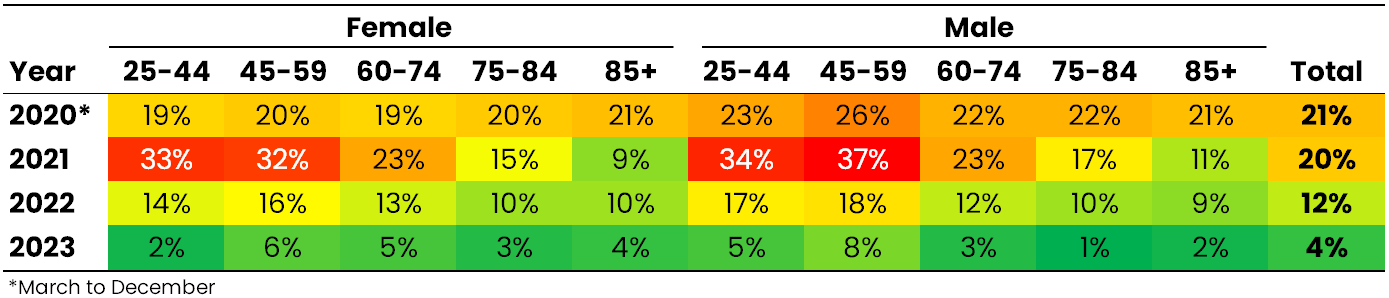
Understanding where non-COVID excess may be headed requires a comprehensive evaluation of each major cause of death and comparing current mortality with pre-pandemic expectations. To that end, subsequent reports in RGA’s analysis of US population mortality will explore the main causes of death individually to determine their contributions to the excess over time. Be sure to check back to view these by-cause reports or sign up to have RGA notify you as they are published.
Coming Soon: By-cause mortality reports
UNDERWRITING “As we emerge from the acute phase of the pandemic, our analyses of U.S. population death data have helped us determine the drivers of mortality improvement.” Catie Muccigrosso Vice President and Chief Underwriter in U.S. Mortality Markets
GLOBAL R&D ”Historical mortality experience is a critical starting point for setting forward-looking biometric assumptions.” Richard Russell Vice President, Biometric Research, Global Research and Development
~1.0%
U.S. CDC population death data can serve as a high-quality leading indicator of where insured mortality improvement may be headed. Anyone with experience in assumption setting understands that mortality improvement is different in the insured population vs. the overall population. That’s too bad since mortality improvement is as important as assumptions get when it comes to pricing and valuation. However, with the granularity of attributes available in the population data, actuaries can develop approaches to transform the population data into something that gets closer to insured experience. CDC population data includes cause of death and, since 1989, highest education level achieved by the decedent. The education mix and the cause-of-death mix differ between insured and overall population: The education mix is a bit higher educated for insured, and the cause-of-death mix skews more towards cancer and much further from non-medical causes than the overall population. The higher education level ties to higher income, which makes life insurance more easily affordable; the cause-of-death profile ties with underwriting. After developing proper exposures for education, population data may be transformed on that axis, but perhaps more importantly, reallocating the cause-of-death profile and running out projections can reveal striking differences between the insured and overall populations. Even when modeling factors such as long-term rates and convergence periods are set equal, differences of more than 1% appear in the early projection years – with typically better improvement in the subset with higher education and a cause-of-death profile resembling an insured block. When taking these factors into account, the CDC data provides valuable insights into the potential direction of improvements in insured mortality.
Jason McKinley
Actuary in Global Research and Development
next expert
prior expert
The post-acute COVID-19 pandemic era has been characterized by remarkable medical advances on several fronts. Understanding the potential impacts of these advances on mortality improvement is essential for risk assessment. Consider the emergence and effectiveness of anti-obesity medications such as GLP-1s. RGA conducted a deep-dive analysis of the potential mortality impacts of GLP-1s in four global markets. The U.S. saw the biggest impact, where mortality rates could be expected to improve around 3.5% by 2045. GLP-1s represent just one of many areas of exciting medical progress, which range from cancer early detection tests to AI-driven innovations in personalized medicine. Such advances can improve health, longevity, and quality of life – and insurance plays a vital role in realizing these benefits. Insurers must rethink traditional approaches, remain adaptable, and collaborate across healthcare, reinsurance, and public sectors.
Dr. Nico van Zyl
Senior Vice President, Chief Medical Director
Historical mortality experience is a critical starting point for setting forward-looking biometric assumptions. Trends over both the long and short term help establish the trajectory from which future mortality improvement assumptions are developed, while cause-specific and all-cause mortality data can help identify whether emerging drivers are beginning to influence observed outcomes. Historical experience therefore has a dual role: informing expectations about future mortality and providing the evidence against which the effects of new and changing mortality drivers can be monitored.
Richard Russell
Vice President, Co-head of Global Biometric Research
Insured population mortality and morbidity assumptions need to be set in the context of the wider general population. The trends and changes observed within the wider population provide insights into some of the dynamics that may filter through to the insured population. This can be helpful in identifying emerging areas where actual experience may deviate from expected experience. For example, the stalling of cardiovascular mortality improvements observed for the working-age population in recent years has filtered through to the insured population experience. Looking to the future, promising medical advancements that, depending on their efficacy and availability to the wider population, may first manifest observable benefits in population data ahead of less credible insured life data.
Elena Tonkovski
VP and Senior Actuary, Insurance Risk
Insurance Risk
global r&d
insurance medicine
mortality trends
As we emerge from the acute phase of the pandemic, our analyses of U.S. population death data have helped us determine the drivers of mortality improvement. Mortality improvement among the general population was a historical trend before COVID-19 and is thankfully an overarching trend once again. While the insured population is only a subset of the general population, the same forces shaping mortality improvement impact both. Underwriters should carefully monitor mortality trends to ensure they are operating from a long-term risk perspective. The good news is that people are living longer. And for the life insurance industry, increased longevity creates greater need for the financial protection we provide: Longer lives mean more years to protect. We can meet that need by making products more accessible, engaging, and relevant – serving as partners in helping people lead long, fulfilling, and secure lives.
underwriting
Catie Muccigrosso
VP and Chief Underwriter in U.S. Mortality Markets
U.S. population mortality experience can help us understand mortality trends and inform assumptions for pensioners. While, in general, pensioner mortality differs from the general population, population mortality can be useful in providing insights due to its comprehensive nature and diverse demographic coverage. The population data is valuable in identifying trends in life expectancy, comparing regional differences, and determining and projecting cohort effects, which requires large datasets. It is particularly useful in areas where pensioner data is sparse, such as for ages above 90 years old. By analyzing population data at a cause-of-death level, we can gain insights into the key influences on, and reasons for, overall mortality outcomes for specific age groups, which helps us to understand past trends. This analysis, coupled with additional research, aids in predicting how mortality may evolve in the future and provides a basis for scenario testing.
Financial Solutions Actuarial
Emily Dave
Actuary in US Longevity Research
Given reporting lags associated with group life data, US population mortality data provides early insights into emerging trends in the group life market. Further, cause-of-death data at more granular breakdowns by age and gender are more credible in the larger U.S. population dataset. That said, group life mortality is lower than mortality in the general population. The SOA’s 2024 Group Term Life Mortality Study shows that, across key working ages, insured mortality is approximately 30%–35% of population mortality. This differential is driven primarily by the actively-at-work requirement, which results in a healthier insured population. Population mortality trends can serve as a leading indicator of trends to monitor. Further, by analyzing population mortality by education level and adjusting for characteristics such as the education profile of the working population and the group life age- and sex-specific cause-of-death distribution, we can gain insight into the future direction of group life mortality.
Group Life Actuarial
Michelle Haines
Vice President, Head of Global CAT and Life, Accident & Special Risk Pricing, U.S. Group Reinsurance
While U.S. individual life mortality is typically thought of as being much lower than general population mortality, population mortality can still help inform assumption-setting for insureds in certain areas. One area is final expense, which generally serves a lower socioeconomic group very different from typical fully underwritten business. No current industry mortality table is even close to appropriate for final expense business. We have found that U.S. population tables provide the best baseline table for developing our internal mortality assumptions for final expense. Final expense mortality increases relative to population as age decreases. The U.S. population baseline also provides useful perspective on the mortality for this unique market segment. U.S. population mortality is also helpful in setting mortality assumptions for very high attained ages. U.S. individual life mortality experience is clearly not as credible at very high attained ages as population experience. The question often arises: Will insured and population mortality eventually converge at some attained age? In other words, will the socioeconomic impacts that drive the difference between insured and population mortality disappear? One can use population mortality data split by a proxy for socioeconomic class to provide an indication of any convergence that could potentially inform assumption-setting at very high attained ages. By comparing the high attained age assumptions for each of our various market segments to a U.S. population basis, we can easily review them for consistency.
Individual Life Actuarial
Susan Willeat
VP and Managing Actuary, Assumptions Lead in U.S. Individual Life
As the impact of COVID-19 on overall mortality diminishes, excess mortality has become a less informative framework for understanding the current landscape. Instead, examining mortality improvement patterns and their underlying drivers provides a more meaningful perspective on where U.S. mortality may be headed. Using data from the Centers for Disease Control and Prevention (CDC) and U.S. Census Bureau, RGA has analyzed mortality trends by age, sex, and cause of death to identify areas where mortality improvement is accelerating, slowing, or stalling. The goal: to help insurers better understand the evolving landscape and its implications for future mortality expectations. The 2026 all-cause trends report serves as a bridge between RGA's excess mortality series and a new annual mortality trends series set to begin in 2027. A focused cancer report examines U.S. cancer incidence and mortality trends across cancer types and age groups. Future publications will continue to track U.S. mortality and provide perspective on the trends most relevant to insurers. To learn about the latest updates as they are published, sign up for RGA’s U.S. mortality analysis email list.
Insurance Medicine “The post-acute COVID-19 pandemic era has been characterized by remarkable medical advances on several fronts. Understanding the potential impacts of these advances on mortality improvement is essential for risk assessment.” Dr. Nico van Zyl Senior Vice President, Chief Medical Director
2015 - 2019
~0.6%
2019 - 2025
~0.8%
U.S. Population All-Cause Mortality Trends Experience up to December 31, 2025
Stay connected
Trusted partner.
Proven results.
top of page
©2026 Reinsurance Group of America, Incorporated. All rights reserved. No part of this publication may be reproduced in any form without the prior permission of the publisher. For requests to reproduce in part or entirely, please contact: publications@rgare.com. RGA has made all reasonable efforts to ensure that the information provided in this publication is accurate at the time of inclusion and accepts no liability for any inaccuracies or omissions. None of the information or opinions contained in this publication should be construed as constituting medical advice.
By Hussain Boricha November 2026
Executive summary U.S. mortality has largely moved beyond the pandemic-era excess mortality phase, and insurers now can start to assess underlying mortality improvements without distortion from temporary COVID-19 pandemic impacts. This paper examines U.S. age-adjusted mortality trends through 2025 and evaluates recent experience relative to historical mortality improvement patterns observed prior to the pandemic. Despite the unprecedented COVID-19 disruption, overall mortality improvement when comparing 2019 to 2025 is broadly consistent with historical experience, with age-adjusted mortality rates resuming their long-term downward trajectory. However, aggregate results mask important differences by age, sex, and cause of death. RGA’s key findings include: The recent improvement in mortality for ages 25-44 reflects a sharp decline in overdose and suicide deaths after years of worsening outcomes driven by the opioid crisis. While mortality is now lower than before the pandemic, behavioral health, substance use, and early-onset cancers remain important influences on mortality outcomes. Mortality trends for ages 45-59 have remained broadly favorable, despite some evidence of improvements slowing down for major causes of death. Overall, post-pandemic experience aligns closely with longer-term pre-pandemic patterns. Unlike younger age groups, adults ages 60-74 have seen minimal mortality improvement in recent years, largely due to slower cancer mortality gains and stagnation in cardiovascular disease outcomes. The influence of Baby Boomer cohort effects may also be contributing to these trends, calling for continued monitoring of this age group. Adults ages 75+ have seen mortality improvement return to or exceed pre-pandemic levels, driven by favorable cardiovascular disease and cancer trends and potentially aided by survivor-selection effects following the pandemic. Overall, U.S. mortality has largely normalized, but the drivers of future mortality improvement are changing. Understanding these evolving drivers is critical for assessing future mortality expectations and emerging risks. Introduction The U.S. mortality landscape is continually evolving, making ongoing monitoring important for insurers and reinsurers. Analysis of population mortality experience can provide valuable insights into emerging trends and changing mortality drivers. Understanding these, and the extent to which they may apply to insured lives and annuitants, underpins forecasting future mortality improvements, which are critical for pricing and reserving. RGA published a series of reports analyzing U.S. excess mortality during and following the COVID-19 pandemic. These reports compared observed mortality experience with expectations based on pre-pandemic trends and considered the direct and indirect impacts of COVID-19 on the U.S. population. As excess mortality gradually declined, the analysis documented the transition from pandemic-driven volatility to a more stable mortality environment. The latest available data suggests that the U.S. has entered a new phase. COVID-19 is no longer a major contributor to overall mortality. For many population segments, mortality levels have largely returned to – or in some cases improved upon – pre-pandemic expectations. At the same time, the further we move from 2019, the more challenging it becomes to assess mortality using an expected basis that relies on projecting pre-pandemic trends many years into the future. While excess mortality was an effective framework for monitoring the pandemic and its aftermath, it is less meaningful for understanding today’s mortality landscape and emerging trends. This paper shifts the focus from excess mortality to mortality improvement. Rather than comparing actual mortality with a projected expected basis, we examine how mortality improvement patterns have changed over time and identify the factors driving these changes. The objective is to understand where mortality progress has accelerated, slowed, or stalled and what those developments may imply for future mortality trends. Using age-adjusted death rates from 1999 through 2025, this paper evaluates mortality trends by age and sex, placing recent experience within the context of longer-term mortality improvement patterns. While the analysis focuses on all-cause mortality, understanding the underlying drivers requires consideration of age groups, sexes, and major causes of death. Together, these factors provide important context for understanding the current state of U.S. mortality and its direction.
References [1] National Center for Health Statistics (NCHS), “Provisional Data: U.S. Death Rate Fell to a Record Low in 2025,” Centers for Disease Control and Prevention (CDC), July 2026, CDC NCHS Blog. [2]Centers for Disease Control and Prevention (CDC), Overdose Data to Action (OD2A), accessed October 5, 2026, CDC Overdose Data to Action Program. [3]Reinsurance Group of America (RGA), U.S. Population Mortality Monitoring, accessed October 5, 2026, RGA Experience Research Portal.
References
A key driver of recent improvement, as shown in Figure 2B, has been the decline in behavioral causes of death, particularly overdose mortality. After increasing steadily throughout the 2010s and reaching a peak in 2021-2022, overdose mortality has fallen significantly in recent years. Potential contributing factors include expanded access to naloxone, improved availability of substance-use treatment, changes in the illicit drug supply, recovery from pandemic-related disruptions, and ongoing public health prevention initiatives, e.g., CDC’s Overdose Data to Action.[2] Mortality rates for this age group have fallen below pre-pandemic levels, a particularly notable turnaround given that both the opioid crisis and the pandemic occurred during this period. Despite this progress, mortality has not fully returned to levels observed at the beginning of the century. Drug overdose remains the leading cause of death among males ages 25-44 and the second-leading cause among females, highlighting its continued influence on mortality outcomes. Cancer is the leading cause of death among females in this age group. Although cancer mortality continues to improve for both sexes, the pace of improvement has moderated compared to the decade preceding the pandemic. Rising colorectal cancer mortality and a slowing rate of improvement in breast cancer mortality appear to be important contributors to this trend, as noted in RGA’s recent paper on cancer trends.[3] For males, suicide ranks as the second-leading cause of death. Encouragingly, suicide mortality has stabilized and modestly improved relative to pre-pandemic trends, partially offsetting some of the deterioration observed during the 2010s. Overall, mortality trends for adults ages 25-44 have improved materially since the pandemic. As a result, mortality for this age group is now below pre-pandemic levels. However, behavioral health, substance use, and early-onset cancers remain important areas to monitor.
Ages 45-59 Figures 3A and 3B summarize mortality trends for adults ages 45-59. It shows that mortality improvement between 2019 and 2025 was broadly consistent with the years immediately preceding the pandemic, while mortality rates have largely returned to their longer-term pre-pandemic trajectory. Although trends differ between males and females, overall experience for this age group has remained relatively favorable.
Hussain Boricha Actuary, Americas Risk Management
Meet the author
In brief Despite years of overall improvement in mortality rates from cancer, it remains the second-leading cause of death in the U.S. The trends shaping its burden are shifting – particularly for certain early-onset cancers. This report examines U.S. cancer incidence and mortality trends across cancer types and age groups, explores the key drivers behind those trends, and considers the implications for insurers.
Download
As shown in Figure 3B, males experienced their strongest mortality improvements during the 2000s before transitioning to a period of more moderate but relatively stable improvement. That pattern largely persisted through the 2010s and into the latest period. Cardiovascular disease is the leading cause of death among males in this age group and was heavily affected during the pandemic. Despite the significant disruption caused by the pandemic, mortality improvement since 2019 has been broadly consistent with recent historical experience, suggesting that longer-term mortality trends for this age group have remained intact. Female historical mortality improvement trends have been volatile; notably, during the early 2010s, mortality for females ages 45-59 deteriorated. Much of this deterioration appears to have been driven by adverse cardiovascular trends, likely reflecting the growing impact of obesity, metabolic disease, and related risk factors. This period was followed by a strong recovery, with mortality improvement accelerating during the latter half of the decade as both cardiovascular disease and cancer mortality trended favorably. Although the pace of improvement has moderated somewhat since the pandemic, the overall trajectory remains positive and has been an important contributor to the favorable experience observed for this age group. Cancer and cardiovascular disease continue to dominate mortality outcomes among adults ages 45-59. Mortality from both causes has generally improved over time, although cancer mortality improvement has slowed relative to the rapid gains achieved during previous decades. Taken together, recent mortality experience for adults ages 45-59 suggests continuity, rather than change, with post-pandemic mortality trends largely reflecting patterns already evident before 2020.
Ages 75-84 Similar to adults ages 60-74, this age group experienced particularly strong mortality improvement during the first decade of the century. Much of this progress was driven by declining lung cancer mortality following reductions in smoking prevalence, together with advances in the prevention and treatment of cancer and cardiovascular diseases. The pace of improvement moderated during the 2010s but remained relatively stable throughout the decade. As shown in Figures 5A and 5B, recent experience suggests that mortality has largely returned to its pre-pandemic trajectory, with the improvement observed between 2019 and 2025 broadly consistent with that recorded in the years leading up to the pandemic.
Ages 25-44 The recent mortality improvements observed among adults ages 25-44 have reversed much of the deterioration observed during the late 2010s. As shown in Figure 2A, mortality rates increased during much of the decade before peaking during the pandemic period. Since then, mortality has declined materially, with age-adjusted death rates now below pre-pandemic levels.
Data and methodology Age-adjusted death rates (AADR) were calculated using death counts from the U.S. Centers for Disease Control and Prevention’s (CDC) National Vital Statistics System (NVSS) and population estimates from the U.S. Census Bureau (USCB). Mortality rates were standardized using the CDC 2000 Standard Population to facilitate comparisons over time. The analysis covers mortality experience from 1999 through 2025, with 2025 treated as provisional. Published USCB population estimates were used through 2020, while population estimates for 2020 onward were sourced from the USCB Vintage 2025 release. Trends are analyzed separately by age and sex to capture differences in mortality dynamics across demographic segments. Mortality improvement was calculated using two different approaches reflecting the disruption caused by the COVID-19 pandemic. For the pre-pandemic period (1999-2019), the average annualized mortality improvement rates were estimated using a linear regression fitted to the logarithm of age-adjusted death rates for each age group. Regressions were fitted separately for overlapping five-year periods. This approach produces a smoothed annual rate of mortality improvement that incorporates information from each year within the period and is less sensitive than a simple compound annual rate calculated between two points in time. The rolling five-year analysis also provides insight into how mortality improvement evolved leading up to the pandemic. For the period 2019-2025, a regression-based measure would be heavily influenced by temporary pandemic-related fluctuations and therefore less informative for evaluating emerging post-pandemic mortality trends. Instead, post-pandemic mortality improvement is measured as the compound annual rate of change between 2019 and 2025 age-adjusted death rates, effectively placing no weight on the acute pandemic period. Throughout this paper, comparisons between historical and recent mortality improvement are intended to highlight how the pace of mortality change has evolved across different population contexts, rather than establish a new long-term mortality trend based on limited post-pandemic observations. Note: A positive mortality improvement rate indicates decreasing mortality over time, while a negative mortality improvement rate indicates increasing mortality experience. All mortality improvement figures presented in this paper are expressed on an annualized basis.
Mortality improvement overview Recent media coverage[1] has highlighted that age-adjusted mortality rates in the U.S. have reached historically low levels and life expectancy has rebounded significantly from its pandemic-era low. While these developments are encouraging, absolute mortality rates alone provide only a partial view of the mortality landscape. Record-low mortality rates would generally be expected to occur periodically during periods of sustained mortality improvement, as was generally observed before the pandemic, driven by medical advances, public health improvements, and changes in population risk factors. Hence, examining the pace of mortality improvement and comparing recent experience with historical improvement patterns provides a more meaningful framework for understanding long-term mortality dynamics than does focusing solely on absolute mortality levels. Figure 1A shows age-adjusted death rates by calendar year for 1999-2025, while Figure 1B shows annualized mortality improvement rates for all ages combined across different periods by sex. Together, these charts provide perspective on both the pace of mortality improvement and the resulting long-term evolution of mortality levels.
The charts show that mortality improvement between 2019 and 2025 was broadly consistent with historical experience. The annualized mortality improvement for both sexes during 2019-2025 was generally comparable to the improvement rates observed across most pre-pandemic periods in the data period covered. The age-adjusted mortality rates have resumed their longer-term downward trajectory following the temporary disruption caused by the COVID-19 pandemic. Historical mortality improvement patterns have varied considerably over the past quarter-century. During the early 2000s, mortality improvement averaged around 1% per annum. Improvement accelerated during the middle of the decade as advances in medical treatment, diagnostic capabilities, and continued reductions in smoking prevalence benefited a broad range of age groups. By contrast, the pace of improvement weakened during the late 2000s and early 2010s as mortality gains among older adults slowed and mortality rates for younger adults began to deteriorate, mainly due to opioid crisis. Against this backdrop, it is notable that mortality improvement between 2019 and 2025 broadly aligns with historical experience. Despite the unprecedented mortality shock created by the COVID-19 pandemic, aggregate mortality levels in 2025 are within the range of outcomes that might reasonably have been anticipated based on pre-pandemic mortality experience. This does not imply that the pandemic had no lasting effect on mortality but rather that, at an aggregate level, mortality has largely returned to a trajectory consistent with longer-term historical patterns. Although aggregate mortality improvement between 2019 and 2025 appears broadly consistent with historical experience, important differences emerge when mortality is analyzed by age and sex. Some demographic segments have recorded substantially stronger mortality improvement than observed historically, while others have experienced a meaningful slowdown. Given the disruption during the pandemic years, these point-to-point results for the 2019-2025 period should be viewed as early indications, rather than established trends. Understanding these differences is critical to interpreting the current mortality landscape.
Conclusion The U.S. mortality landscape has entered a new phase. As the impact of COVID-19 on overall mortality continues to diminish, excess mortality has become a less meaningful framework for understanding the current mortality landscape. A mortality improvement perspective provides a more useful lens for evaluating how mortality patterns are evolving and where future risks and opportunities may emerge. While aggregate U.S. mortality has broadly returned to its long-term improvement trajectory, the sources of future mortality improvement are changing. Continued monitoring of these underlying drivers will be essential for understanding future mortality expectations. Author’s note: This publication serves as a bridge between RGA’s excess mortality series and a planned annual mortality trends publication beginning in 2027. Future publications will provide more detailed cause-of-death analysis and continue to monitor emerging mortality patterns and their implications for population and insured mortality.
Looking beyond aggregate mortality measures is essential to understanding future risks and opportunities.
Breast cancer also shows increasing trends. [21-22] Localized breast cancer incidence has increased for all ages and adults under 50 (Figure 8). [17, 23] Distant-stage breast cancer diagnoses rose roughly 68% between 2004 and 2023 for women under 50 (Table 2).
Ages 60-74 Figures 4A and 4B highlight the mortality experience of adults ages 60-74. Unlike the other age groups examined, only marginal overall mortality improvement was observed between 2019 and 2025 for either sex. The mortality levels in 2025 were broadly similar to those observed immediately prior to the pandemic, despite substantial mortality progress during earlier decades.
The exceptionally strong improvements observed during the 2000s were driven primarily by rapid declines in cancer mortality, particularly lung cancer, reflecting decades of smoking cessation and advances in cancer detection and treatment. Cancer remains the leading cause of death for adults ages 60-74, and the pace of mortality improvement has slowed considerably in recent years. While lung cancer mortality continues to decline, other sites present less favorable trends, particularly colorectal cancer. Cardiovascular disease ranks a close second-leading cause of death for this age group and presents a different challenge. Cardiovascular mortality has shown little sustained improvement over the past 15 years, with mortality levels higher in 2025 than in 2019. The persistence of obesity, metabolic disease, and other cardiovascular risk factors may be limiting further progress, despite ongoing advances in treatment and care. At present, this age range largely encompasses the Baby Boomer generation; a portion of this generation has historically exhibited lower mortality improvements than preceding generations. For adults ages 60-74, the slowdown in cancer improvement, combined with limited progress against cardiovascular disease, has been accompanied by rising mortality within the broader category of other diseases, including metabolic, infectious, digestive, mental health, and other chronic conditions. Together, these trends have substantially reduced the pace of mortality improvement compared with historical experience, making it an important area for continued monitoring.
Cardiovascular disease remains the leading cause of death for this age group, and improved cardiovascular outcomes continue to be a major contributor to mortality improvement. Post-pandemic cardiovascular mortality trends have been particularly favorable for males, while improvement among females has been more modest. One possible contributor could be mortality displacement or survivor-selection effects following the pandemic. COVID-19 mortality disproportionately affected older, medically vulnerable adults and was higher among men, potentially altering the health composition of the surviving population. However, the extent to which such effects explain the recent improvement in cardiovascular mortality remains uncertain. Cancer mortality also continues to improve at a pace broadly consistent with historical experience. Unlike younger age groups, where cancer improvement has slowed noticeably, adults ages 75-84 have not experienced the same degree of moderation. This may reflect age-period-cohort effects, particularly for lung and colorectal cancers, where older generations continue to benefit more from stronger mortality improvement than younger cohorts. Not all mortality trends have been favorable. Mortality associated with digestive, metabolic, mental health, infectious, and other chronic medical conditions remains elevated relative to pre-pandemic levels, partially offsetting gains from cardiovascular disease and cancer. Nevertheless, the overall mortality experience for ages 75-84 suggests that long-term improvement trends have largely re-established themselves following the disruption of the pandemic. Whether these favorable trends persist among adults ages 75-84 remains an important question, particularly as the Baby Boomer generation moves into this age range and may bring with it some of the cohort-related mortality dynamics currently observed among adults ages 60-74.
Ages 85+ Adults ages 85 and older recorded the strongest mortality improvement between 2019 and 2025 of any age group examined. Figures 6A and 6B highlight this experience. Improvements were observed for both sexes but were particularly pronounced among males.
Mortality improvement among adults ages 85 and older has historically been more volatile than for other age groups. Following relatively modest improvement at the start of the century, mortality improvement accelerated significantly during the mid-2000s. However, this period was followed by a marked deterioration around 2007-2011, particularly among males, before gradually recovering throughout the remainder of the 2010s. Cardiovascular disease remains the dominant cause of death at these ages, and improved cardiovascular outcomes were the primary contributor to the favorable mortality experience observed over 2019-2025. Cancer mortality also continued to improve at a higher rate during 2019-2025, and neurological and pulmonary mortality trends were more favorable than before the pandemic. Increasing mortality improvement trends were observed across nearly all major cause-of-death groups. Similar to ages 75-84, these results may partly reflect survivor-selection effects following the pandemic. Taken together, the experience of adults ages 85 and older suggests that mortality improvement has not only recovered from the disruption caused by the pandemic but, in several respects, has exceeded the pace observed prior to 2020.
Implications and emerging trends Despite the unprecedented disruption caused by the COVID-19 pandemic, aggregate mortality improvement between 2019 and 2025 was broadly consistent with historical experience. However, the underlying drivers of mortality continue to evolve. The sharp decline in overdose mortality for younger adults has helped reverse much of the adverse mortality trends of the past decade, while mortality at older ages has generally returned to pre-pandemic improvement patterns. At the same time, several areas warrant continued monitoring. The lack of meaningful improvement among adults ages 60-74 is particularly notable. Slowing cancer mortality improvement, limited progress against cardiovascular disease, and increasing mortality associated with metabolic and other chronic conditions may signal a more challenging mortality environment for future improvement. Looking ahead, obesity and metabolic disease are likely to remain important influences on mortality outcomes. Emerging therapies have the potential to improve future mortality experience. For example, GLP-1 medications may become an increasingly important influence on mortality trends in the years ahead, as discussed in RGA’s paper: GLP-1 Study: Weighing the Evidence. Continued monitoring of cancer trends, cardiovascular disease, substance use, and infectious disease risks will also be important. The recent slowdown in mortality improvement among adults ages 60-74 may partly reflect the influence of Baby Boomer cohort effects. If so, these dynamics could continue to shape mortality experience as this generation transitions into older age groups. At the same time, some of the strong mortality improvement observed at older ages since the pandemic may reflect temporary survivor-selection effects, which could gradually diminish over time and lead to more moderate improvement rates in future years. For insurers and reinsurers, these findings reinforce the importance of looking beyond aggregate mortality measures. While overall mortality improvement appears broadly consistent with historical expectations, future experience is likely to vary considerably by age, sex, and cause of death. Although the drivers of mortality change may not align exactly between insured and general population cohorts, population mortality trends can provide valuable early insight into emerging developments that may ultimately influence insured experience. Understanding these underlying drivers is critical for assessing future mortality improvement assumptions and identifying emerging mortality risks and opportunities.
Population mortality trends can provide early insight into emerging developments that may eventually affect insured mortality experience.
Cancer Trends in Transition: Progress, plateaus, and pressures
By Hussain Boricha, Kaitlyn Fleigle, and Netanya Martin July 2026
Key takeaways Between 2000 and 2025, overall cancer death rates in the U.S. fell 30% for females and 37% for males. On the incidence side, the picture is more mixed. Between 2000 and 2023, U.S. cancer incidence rates increased 9% for females and declined 10% for males, although males showed a 5% increase in incidence from 2014 to 2023. Cancer mortality improvements for U.S. adults aged 25–44 have slowed in recent years. Colorectal cancer is particularly notable: Mortality in this age group has been rising for decades. Cancer incidence among U.S. younger adults is increasing. This is evident for all stages of colorectal cancer and most stages of breast cancer, including distant stages for both. The drivers behind U.S. cancer trends are layered and evolving. A cohort effect is evident – particularly for colorectal cancer – with notably worse mortality improvements for those born in more recent decades. Many U.S. adults are not up to date on recommended cancer screenings, particularly those at the lower end of the screening-eligible age range. Adults with higher education, higher income, and insurance coverage screen at higher rates. The picture is not uniformly negative. Some risk factors – notably tobacco use – have improved, and meaningful advances in prevention, detection, and treatment have emerged. These trends carry many implications for insurers, spanning underwriting, anti-selection risk, screening gaps, and the ongoing importance of cause-of-death analysis and trend monitoring. Introduction Cancer is the second-leading cause of death in the U.S. and the leading cause of death for people aged 45–64. Cancer mortality has been declining for years, driven by treatment advances, earlier detection, and decades of public health progress. Yet early-onset cancers have been making headlines due to some notable increases in certain cancer types among younger adults. [1-4] In June 2026, Nature published an article titled Why are so many young people getting cancer? What researchers do and don’t know, focusing on the rising rates of cancer in people under 50. [5] The article noted that possible explanations are emerging but are likely to vary from one type of tumor to another. RGA has explored early-onset colorectal cancer trends in two recent reports: Early-Onset Colorectal Cancer and Implications for the Life Insurance Industry and Early-Onset Cancer: What my case helps reveal for underwriters. [6-7] Both reports highlight rising incidence in younger populations, the key drivers behind it, and considerations for insurers. So, what about mortality? Have we seen increases in cancer mortality alongside the rise in reported incidence? And what else can these trends tell us? This report looks further into these changing trends, examining who is experiencing the biggest shifts, where new risks are emerging, and what all of it means for insurers. The report examines mortality trends for all ages (data spanning 1999–2025), with additional focus on younger adults, comparing these mortality trends to incidence trends (data spanning 2000–2023). The report also highlights potential trend drivers and the implications for insurers.
References [1] V. Patel, A. Adamson and G. Welch, "The Rise in Early-Onset Cancer in the US Population—More Apparent Than Real," 29 September 2025. [Online]. Available: https://jamanetwork.com/journals/jamainternalmedicine/article-abstract/2839347. [2] C. Phillips, "As Rates of Some Cancers Increase in Younger People, Researchers Search for Answers," 14 May 2025. [Online]. Available: https://www.cancer.gov/news-events/cancer-currents-blog/2025/early-onset-cancer-research-environment-genetics-support. [3] Agency for Healthcare Research and Quality (US), "National Healthcare Quality and Disparities Report," December 2023. [Online]. Available: https://www.ncbi.nlm.nih.gov/books/NBK600454/table/ch2.tab4/. [4] A. E. Cha, D. Keating, J. Chikwendiu and L. Melgar, "The mysterious rise of cancer among young adults in the corn belt," 27 October 2025. [Online]. Available: https://www.washingtonpost.com/health/2025/10/27/young-cancer-iowa/. [5] H. Ledford, "Why are so many young people getting cancer? What researchers do and don’t know," 06 June 2026. [Online]. Available: https://www.nature.com/articles/d41586-026-01780-6. [6] J. Waas, F. Abdulkafarova and P. Dr. Dalawari, "Early-Onset Cancer: What my case helps reveal for underwriters," March 2006. [Online]. Available: https://www.rgare.com/knowledge-center/article/early-onset-cancer--what-my-case-helps-reveal-for-underwriters. [7] R. Dr. Hide, "Early-Onset Colorectal Cancer and Implications for the Life Insurance Industry," February 2026. [Online]. Available: https://www.rgare.com/knowledge-center/article/early-onset-colorectal-cancer-and-implications-for-the-life-insurance-industry. [8] M. Shiels, A. Haque, A. Berrington de González, M. C. Camargo and et. Al, "Trends in Cancer Incidence and Mortality Rates in Early-Onset and Older-Onset Age Groups in the United States, 2010-2019," 03 07 2025. [Online]. Available: https://pubmed.ncbi.nlm.nih.gov/40338148/. [9] K. P. Sharma, S. D. Grosse, M. V. Maciosek, D. M. Joseph, K. Roy, L. M. Richardson and H. Jaffe, "Preventing Breast, Cervical, and Colorectal Cancer Deaths: Assessing the Impact of Increased Screening," 8 October 2020. [Online]. Available: https://www.cdc.gov/pcd/issues/2020/20_0039.htm. [10] C. C. Murphy and T. A. Zaki, "Changing epidemiology of colorectal cancer — birth cohort effects and emerging risk factors," 18 September 2023. [Online]. Available: https://www.nature.com/articles/s41575-023-00841-9. [11] C. R. Marinaca and B. M. Birmannc, "Rising cancer incidence in younger adults: is obesity to blame?," March 2019. [Online]. Available: https://www.thelancet.com/journals/lanpub/article/PIIS2468-2667(19)30017-9/fulltext. [12] R. Tian, X. Zong, D. Ren, S. Tica, D. Hong, O. Oduyale, J. D. Buenrostro, R. Govindan and Y. Cao, "Biological aging and generational shifts in early-onset cancer risk," 22 June 2026. [Online]. Available: https://www.nature.com/articles/s41591-026-04448-w. [13] M. Garcia-Closas, Z. Richards, R. Frost, M. J. Gunter and A. Berrington de Gonzalez, "Temporal trends in behavioural risk factors for cancers with rising incidence in younger adults: an analysis of population-based data in England," 28 April 2026. [Online]. Available: https://bmjoncology.bmj.com/content/5/1/e000966. [14] H. Sung, C. Jiang, P. Bandi, A. Minihan and et al. , "Differences in cancer rates among adults born between 1920 and 1990 in the USA: an analysis of population-based cancer registry data," The Lancet Public Health, vol. 9, no. 8, pp. E583-E593, August 2024. [15] P. Dharwadkar, T. Zaki and C. Murphy, "Colorectal cancer in younger adults," 13 May 2022. [Online]. Available: https://pmc.ncbi.nlm.nih.gov/articles/PMC9177054/. [16] N. Akimoto, T. Ugai, R. Zhong and et al., "Rising incidence of early-onset colorectal cancer: a call for action," 20 November 2020. [Online]. Available: https://pmc.ncbi.nlm.nih.gov/articles/PMC7994182/. [17] R. E. Hendrick and D. Monticciolo, "Surveillance, Epidemiology, and End Results Data Show Increasing Rates of Distant-Stage Breast Cancer at Presentation in U.S. Women," 10 December 2024. [Online]. Available: https://pubs.rsna.org/doi/epdf/10.1148/radiol.241397. [18] E. Schafer, H. Sung and J. Star, "Colorectal Cancer Incidence in US Adults After Recommendations for Earlier Screening," 4 August 2025. [Online]. Available: https://jamanetwork.com/journals/jama/fullarticle/2837232. [19] A. Zaborowski, "Colorectal Cancer in the Young: Research in Early Age Colorectal Cancer Trends (REACCT) Collaborative," 30 May 2023. [Online]. Available: https://pmc.ncbi.nlm.nih.gov/articles/PMC10252092/. [20] Surveillance, Epidemiology, and End Results Program (SEER), "Surveillance Research Program, National Cancer Institute," 12 May 2026. [Online]. Available: https://seer.cancer.gov/statistics-network/explorer/. [Accessed 8 June 2026]. [21] M. Rosa, "Advances in Breast Cancer in the last 100 years: The Road from Radical Treatments to Personalized Medicine," 17 Oct 2022. [Online]. Available: https://criticalvalues.org/news/all/2022/10/17/advances-in-breast-cancer-in-the-last-100-years-the-road-from-radical-treatments-to-personalized-medicine. [22] J. Koh and M. J. Kim, "Introduction of a New Staging System of Breast Cancer for Radiologists: An Emphasis on the Prognostic Stage," 27 December 2018. [Online]. Available: https://pmc.ncbi.nlm.nih.gov/articles/PMC6315072/. [23] American Cancer Society, "Breast Cancer Facts & Figures 2024-2025," 2024. [Online]. Available: https://www.cancer.org/content/dam/cancer-org/research/cancer-facts-and-statistics/breast-cancer-facts-and-figures/2024/breast-cancer-facts-and-figures-2024.pdf. [24] S. Siddique, R. Wang, F. Yasin, J. J. Gaddy, L. Zhang, C. P. Gross and X. Ma, "USPSTF Colorectal Cancer Screening Recommendation and Uptake for Individuals Aged 45 to 49 Years," 3 October 2024. [Online]. Available: https://pmc.ncbi.nlm.nih.gov/articles/PMC11450516/. [25] K. Farrar, D. Do, N. B. Masters and B. M. Goodwin Cartwright, "Breast cancer screening and detection after the 2024 USPSTF recommendation for women aged 40–49.," 27 May 2026. [Online]. Available: https://ascopubs.org/doi/10.1200/JCO.2026.44.16_suppl.11126. [26] Office of Disease Prevention and Health Promotion, "Healthy People 2030," 2023. [Online]. Available: https://odphp.health.gov/healthypeople/objectives-and-data/browse-objectives/cancer/increase-proportion-adults-who-get-screened-colorectal-cancer-c-07. [Accessed 3 June 2026]. [27] A. Wolf, R. M. Hoffman, L. C. Walter, C. M. Zeigler-Johnson and T. R. Church, C. E. Guerra, E. B. Elkin, R. Etzioni, A. Herzig, K. C. Oeffinger, R. B. Perkins, S. Raoof, Y. T. Shih, S. J. Skates, T. B. Kratzer, D. Manassaram‑Baptiste, and R. A. Smith "Colorectal cancer screening: An update to the American Cancer Society guideline, 2026," 27 May 2026. [Online]. Available: https://acsjournals.onlinelibrary.wiley.com/doi/10.3322/caac.70083. [28] S. Sabatino, T. Thompson, J. Croswell, M. Villarroel and e. Al, "Use of Cancer Screening Tests, United States, 2023," 14 August 2025. [Online]. Available: https://www.cdc.gov/pcd/issues/2025/25_0139.htm. [29] H. Akhondi, E. A. Kalteh and M. H. Lotfi, "Common Risk Factors in Gastrointestinal Cancers: A Narrative Review," 8 July 2025. [Online]. Available: https://pmc.ncbi.nlm.nih.gov/articles/PMC12503528/. [30] G. C. Meine, R. V. Picon, P. A. E. Santo and G. B. Sander, "Ultra-Processed Food Consumption and Gastrointestinal Cancer Risk: A Systematic Review and Meta-Analysis," American Journal of Gastroenterology, 1 June 2024. [Online]. Available: https://pubmed.ncbi.nlm.nih.gov/38832708/. [31] A. Schumacher, Q. Chen, V. Attaluri, E. McLemore and C. Chao, "Metabolic Risk Factors Associated with Early-Onset Colorectal Adenocarcinoma: A Case–Control Study at Kaiser Permanente Southern California Free," 01 October 2021. [Online]. Available: https://aacrjournals.org/cebp/article/30/10/1792/665655/Metabolic-Risk-Factors-Associated-with-Early-Onset. [32] T. Jayakrishnan and K. Ng, "Early-Onset Gastrointestinal Cancers: A Review," 17 July 2025. [Online]. Available: https://jamanetwork.com/journals/jama/fullarticle/2836671. [33] T. Wu, Z. Bian, N. Qin and J. Chen, "Trends in pancreatic cancer mortality among US adults, 1999–2023," 28 October 2025. [Online]. Available: https://link.springer.com/article/10.1186/s12876-025-04354-4. [34] M. R. Saraiva, I. Rosa and I. Claro, "Early-onset colorectal cancer: A review of current knowledge," 28 February 2023. [Online]. Available: https://pmc.ncbi.nlm.nih.gov/articles/PMC10011966/. [35] H. Cavalier, L. Trasande and M. Porta, "Exposures to pesticides and risk of cancer: Evaluation of recent epidemiological evidence in humans and paths forward," 15 December 2021. [Online]. Available: https://onlinelibrary.wiley.com/doi/pdf/10.1002/ijc.34300. [36] H. Henly, "Do Microplastics Affect Human Health?," April 2023. [Online]. Available: https://www.rgare.com/knowledge-center/article/do-microplastics-affect-human-health. [37] S. Li, P. Oliva, L. Zhang, J. Goodrich, R. McConnell, D. Conti, L. Chatzi and M. Aung, "Associations between per-and polyfluoroalkyl substances (PFAS) and county-level cancer incidence between 2016 and 2021 and incident cancer burden attributable to PFAS in drinking water in the United States," 9 January 2025. [Online]. Available: https://www.nature.com/articles/s41370-024-00742-2. [38] A. Mendy and P. S. Thorne, "Long-Term Cancer and Overall Mortality Associated with Drinking Water Nitrate in the U.S," 1 March 2025. [Online]. Available: https://pmc.ncbi.nlm.nih.gov/articles/PMC11626709/. [39] F. Islami, G. Arias, D. Lee, D. Wiese, J. Baeker Bispo, K. R. Yabroff, R. L. Siegel, P. Bandi, N. Nargis, A. V. Patel, P. P. Thienprayoon, A. H. Kamal, E. C. Daniels, C. M. Annunziata, K. Sloan, L. A. Lacasse, R. A. Winn, O. W. Brawley, C. E. Guerra, W. L. Dahut and A. Jemal, "American Cancer Society’s Report on the Status of Cancer Disparities in the United States, 2025," 16 December 2025. [Online]. Available: https://acsjournals.onlinelibrary.wiley.com/doi/full/10.3322/caac.70045. [40] T. Burus, H. Damgacioglu, B. Huang and et al., "Survival of Patients Diagnosed With Cancer During the COVID-19 Pandemic," 5 February 2026. [Online]. Available: https://jamanetwork.com/journals/jamaoncology/fullarticle/2844749. [41] Y. D. P. Hong, N. M. Howlader, A.-M. Noone and A. B. Mariotto, "Assessing the effect of the COVID-19 pandemic on 1-year cancer survival in the United States," 25 October 2004. [Online]. Available: https://academic.oup.com/jnci/article/117/5/1064/7841930. [42] F. Islami, N. Nargis, Q. Liu, P. Bandi, R. L. Siegel, P. P. Choudhury, N. D. Freedman, K. E. Warner and A. Jemal, "Averted lung cancer deaths due to reductions in cigarette smoking in the United States, 1970–2022," 25 March 2025. [Online]. Available: https://pmc.ncbi.nlm.nih.gov/articles/PMC12061630/. [43] Substance Abuse and Mental Health Services Administration, "National Survey on Drug Use and Health (NSDUH)," 2024. [Online]. Available: https://www.samhsa.gov/data/data-we-collect/nsduh-national-survey-drug-use-and-health/national-releases/2024. [44] R. Russell, A. Gaskell, R. Lalia, C. Armstrong, C. Falkous, J. J. Lefebre, M. Battersby and M. Kotze, "RGA GLP-1 Study: Weighing the Evidence: Quantifying the mortality and morbidity impacts of GLP-1 and other incretin-based drugs in the US, UK, Canada, and Hong Kong populations," 2025. [45] S. Shrestha, H. Foot, M. Sheikh, M.-O. Parat and A. La Caze, "Opioid use and the risk of cancer incidence and mortality: a systematic review," 11 June 2025. [Online]. Available: https://pmc.ncbi.nlm.nih.gov/articles/PMC12159095/. [46] F. Damgaard, M. Jespersen, J. K. Møller, J. E. Coia, T. V. Sydenham and et al. , "Distinct prophage infections in colorectal cancer-associated Bacteroides fragilis," 07 February 2026. [Online]. Available: https://www.nature.com/articles/s43856-026-01403-1. [47] M. Imai, Y. Nakamura and T. Yoshino, "Transforming cancer screening: the potential of multi-cancer early detection (MCED) technologies," 12 January 2025. [Online]. Available: https://pmc.ncbi.nlm.nih.gov/articles/PMC11785667/. [48] U. Ladabaum, J. Dominitz, C. Kahi and R. Schoen, "Strategies for Colorectal Cancer Screening," Gastroenterology, vol. 158, no. 2, pp. 418-432, January 2020. [49] C. Murphy, A. Sedani and B. Balasubramanian, "Younger Adults, Earlier Screening—What We Are Learning About Colorectal Cancer and What Comes Next," 4 August 2025. [Online]. Available: https://jamanetwork.com/journals/jama/fullarticle/2837233?widget=personalizedcontent&previousarticle=0. [50] X. Chen, J. Gole, A. Gore, Q. He, M. Lu and et. Al, "Non-invasive early detection of cancer four years before conventional diagnosis using a blood test," 21 July 2020. [Online]. Available: https://pubmed.ncbi.nlm.nih.gov/32694610/. [51] M. W. Qoronfleh, "Precision Medicine and the Human Proteome in Disease, Diagnostics and Translation: Current Status and Future Prospects," 7 May 2025. [Online]. Available: https://pmc.ncbi.nlm.nih.gov/articles/PMC12109353/. [52] J. Pei, T. Shu, C. Wu, M. Li, M. Xu, M. Jiang and C. Zhu, "Impact of human papillomavirus vaccine on cervical cancer epidemic: Evidence from the surveillance, epidemiology, and end results program," 06 January 2023. [Online]. Available: https://pmc.ncbi.nlm.nih.gov/articles/PMC9859059/. [53] American Cancer Society, "Cancer Vaccines and Their Side Effects," 7 July 2025. [Online]. Available: https://www.cancer.org/cancer/managing-cancer/treatment-types/immunotherapy/cancer-vaccines.html. [54] R. Rubin, "How mRNA Vaccines Could Help Treat Cancer," 10 April 2026. [Online]. Available: https://jamanetwork.com/journals/jama/fullarticle/2847793. [55] N. McGarvey, M. Gitlin, E. Fadli and K. C. Chung, "Increased healthcare costs by later stage cancer diagnosis," 13 September 2022. [Online]. Available: https://pmc.ncbi.nlm.nih.gov/articles/PMC9469540/.
As Figure 4 illustrates, this landscape looks quite different from just two decades ago. For adults aged 25–44, lung and bronchus cancer was the leading cancer cause of death for males and the second-leading cause for females. This has since shifted, driven by strong and sustained declines in lung and bronchus cancer mortality, alongside a notable rise in colorectal cancer mortality. These shifts reflect uneven progress in prevention, detection, and treatment across cancer types, as well as underlying risk factors evolving differently across generations, producing distinct patterns by age. The decline in smoking is possibly the single-biggest driver of change; it has led to sharp reductions in lung and bronchus cancer mortality, particularly in older adults. As lung cancer deaths have fallen, other cancers (e.g., colorectal in younger adults) have become relatively more prominent.
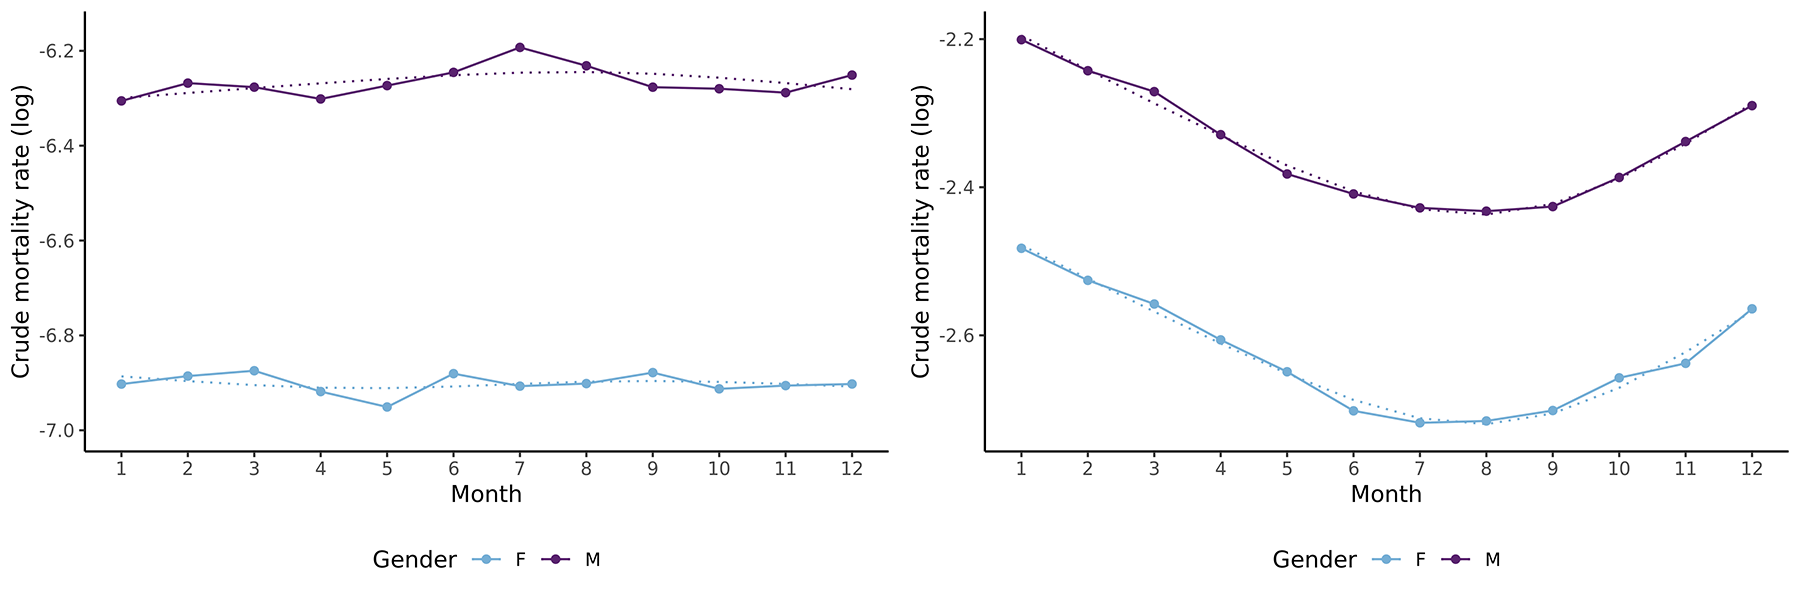
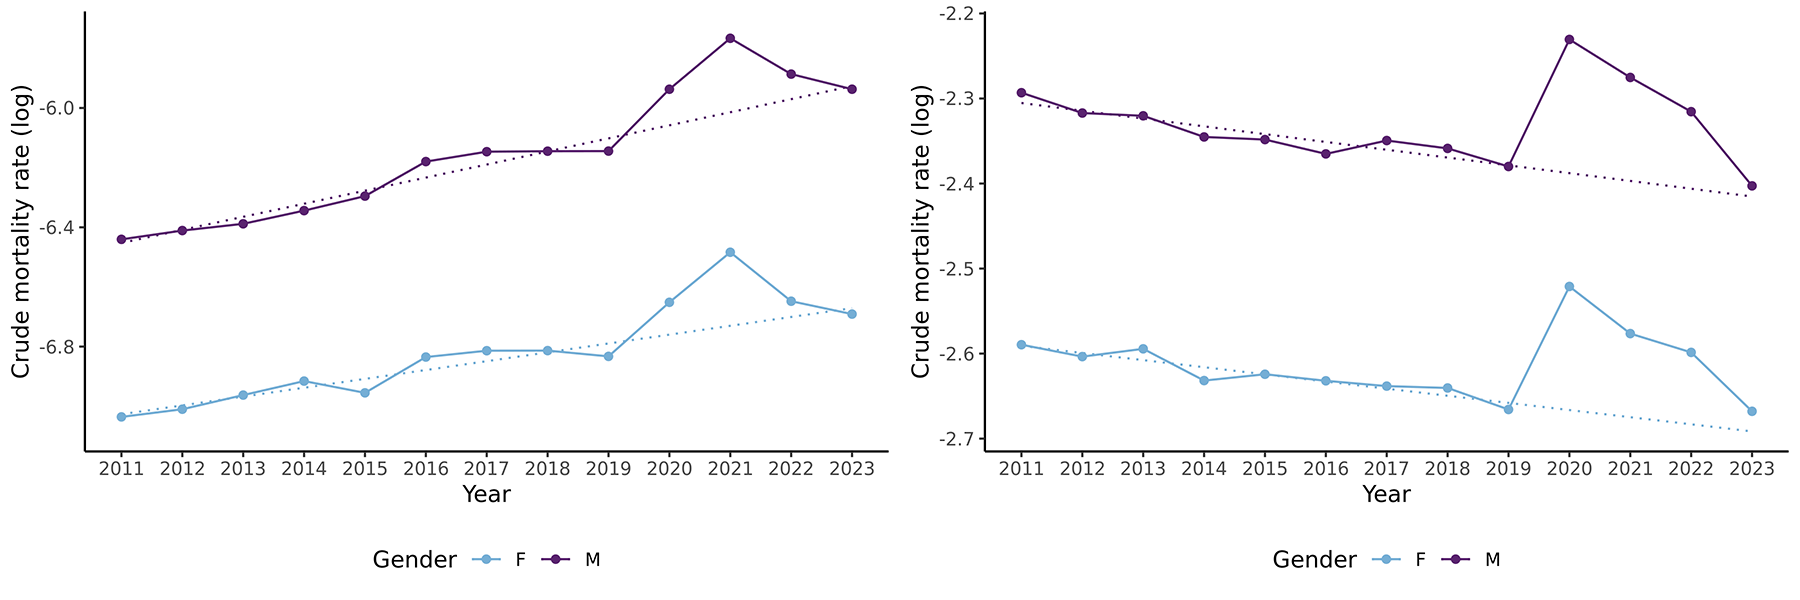
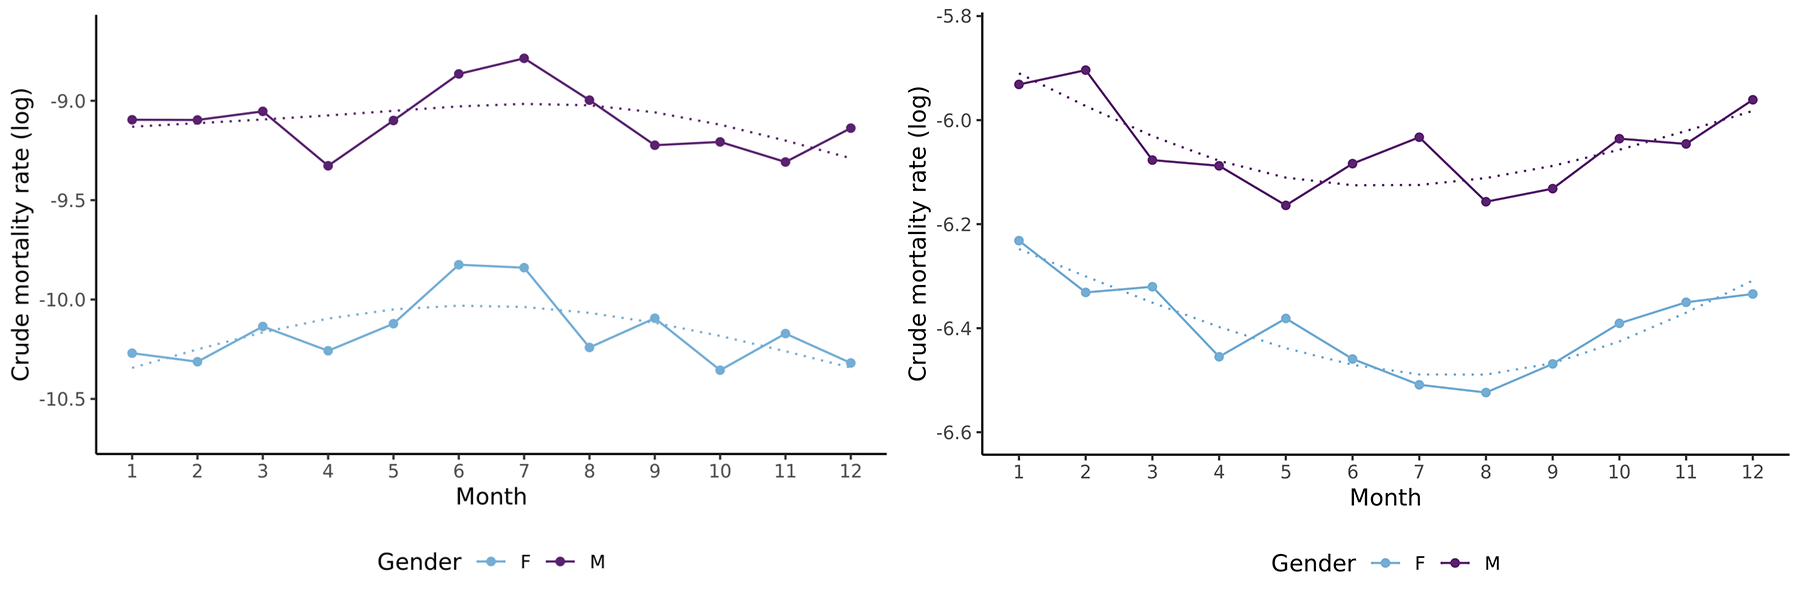
Contrasting mortality and incidence trends of select cancer sites While cancer incidence trends are important, they can be difficult to interpret. Increasing cancer incidence is often mistaken as evidence of increasing disease driven by harmful exposures, behaviors, or other factors; however, it can also reflect heightened diagnostic testing or changes in diagnostic criteria. To better understand incidence trends, it is essential to compare them to cancer mortality trends. While not immune to biases such as cause-of-death misclassification, mortality is far less influenced by changes in screening practices and other diagnostic investigations. It remains the most robust signal of underlying disease burden. Accordingly, analyzing incidence and mortality trends together offers a more complete picture than either measure alone. Rising incidence without a corresponding rise in mortality, for instance, might signal increased screening and diagnosis, rather than worsening disease burden. A recent study pointed out a lack of a substantial rise in cancer deaths, despite rising incidence. However, the study included only U.S. cancer trends up to 2022. [1] Figures 5A and 5B examine mortality and incidence trends for select cancer sites across all ages and the 25–44 age group, broken out by sex. Several patterns stand out: Declines in mortality and incidence for lung and bronchus cancer have continued but appear to have slowed down for adults aged 25–44. Male prostate cancer diagnoses have increased in recent years, while the rate of mortality improvement has lessened. Male leukemia diagnoses have increased, while mortality has continued to decline. Rising breast cancer diagnoses in women have not translated into rising mortality, although mortality improvements appear to be slowing for women aged 25–44. The most consequential finding concerns colorectal cancer. Both incidence and mortality for colorectal cancer have been rising for decades in adults aged 25–44. In 2025, colorectal cancer death rates for adults aged 25–44 were 47% higher for males and 26% higher for females compared to 1999. While not included in the figures, other cancer sites have also shown increasing trends – for example, mortality and incidence in liver cancer.
Netanya Martin Data Scientist, Global Research and Development
Kaitlyn Fleigle Actuary, Strategic Research
Meet the authors
Cohort effects Cancer drivers are not uniform across generations, and studying birth cohort effects in cancer trends can reveal important patterns. Figures 6A and 6B examine cohort effects by comparing the mortality improvement trends by age and calendar year, in which diagonal lines represent a birth cohort. Figure 6A shows clear birth cohort patterns with overall cancer mortality improvement, in which those born around 1970 or after have slightly lower improvements than older cohorts. This reflects a mix of effects, including shifting risk factors and uneven medical progress, rather than a single cause. However, one very important driver of cancer mortality improvement in older cohorts is smoking patterns. Older cohorts (born before 1970) experienced high levels of smoking, followed by substantial declines, which translated into large reductions in cancer mortality as tobacco exposure fell. In contrast, post-1970 cohorts entered adulthood with lower smoking prevalence, leaving less scope for similar improvements. As a result, one of the biggest historical drivers of cancer mortality reduction has largely been exhausted for younger generations. Figure 6B shows clear evidence of a birth cohort effect for colorectal cancer: Those born around 1960 or later have experienced significantly lower colorectal cancer mortality improvement than older cohorts. Similar birth cohort effects have been documented globally, with higher colorectal cancer incidence observed in individuals born since the early 1950s, pointing to exposures earlier in life as key drivers of risk. [10]
Several plausible explanations have emerged for this cohort effect. Obesity and diet are widely considered likely contributors, as both obesity and childhood obesity have risen over time. Studies of cancer incidence trends in the U.S. and England suggest that rising BMI levels are a significant contributor to the increase in early-onset cancers, including colorectal cancer. [11-13] Exposure to antibiotics, environmental chemicals, and pesticides has also been proposed as a contributing factor. Events or exposures experienced during formative developmental years, childhood, and young adulthood can imprint on cellular biology, setting the stage for malignancies that manifest decades later. [14-16] Together, these cohort patterns and changing trends point to a complex and layered set of drivers. Risk factors and drivers Evolving cancer trends raise a natural set of questions: What is driving these changes to cancer incidence and mortality? Has the stage at which cancers are being diagnosed shifted? How does screening behavior compare for different groups, and where are the gaps? Staging Shifts in the stage at which cancers are diagnosed offer an important part of the explanation for the mortality changes seen at younger ages. [17] An assessment of incidence rates by stage of diagnosis drawn from SEER for all ages and for adults under 50 provides insight into this. Colorectal cancer incidence in adults under 50 has increased across all stages for many years (Figure 7). In this age group, localized colorectal cancer incidence nearly doubled between 2004 and 2023, with a notable jump between 2020 and 2023 – potentially reflecting the expansion of screening options, including less-invasive alternatives, and the lowering of the recommended screening age from 50 to 45. [18] More notable is the rise in distant-stage (i.e., cancer has metastasized) colorectal cancer in this age group. Between 2004 and 2023, distant colorectal cancer incidence rose 67% among adults under 50, with a five-year relative survival rate estimated to be just under 28% (Table 1). [19, 20]
Screening Some of these staging shifts point – at least in part – to gaps in screening coverage, although they are likely shaped by a range of other contributing factors as well. The U.S. Preventive Services Task Force (USPSTF) lowered the recommended age for colorectal cancer screening from 50 to 45 in 2021, and for breast cancer from 50 to 40 in 2024. Prior to the breast cancer change, women aged 40–49 were left to make that decision on their own. [24, 25] As for colorectal cancer screening, participation has nearly doubled over two decades, rising from under 40% in 2000 to nearly 73% in 2023 for adults aged 50–75. [26] However, gaps remain among younger adults – only 37% of those aged 45–49 and 55% of those aged 50–54 report being up to date on recommended colorectal cancer screening. [27] Breast cancer screening rates are higher, with about 80% of women aged 50–74 being up to date on screening in 2023. [28] Breaking down those numbers by age, income, education, and insurance coverage reveals where gaps remain (Figure 9). Younger adults have lower screening rates, while those with higher education, higher income, or insurance coverage generally screen at higher rates than their counterparts.
Appendix CDC and SEER mapping for each cancer type
Cancer Type Oral and Pharynx Esophagus Stomach Colon and Rectum Liver and Intrahepatic Bile Ducts Pancreas Lung and Bronchus Melanoma Breast Cervix Uterus Ovary Prostate Testis Kidney and Renal Pelvis Urinary Bladder Brain and ONS Thyroid Hodgkin Lymphoma Non-Hodgkin Lymphoma Leukemia
ICD-10 Codes (CDC) C00-C14 C15 C16 C18-C20 C22 C25 C34 C43 C50 C53 C54-C55 C56 C61 C62 C64-C65 C67 C70-C72 C73 C81 C82-C86, C96 C91-C95
Delay Site (SEER) Oral Cavity and Pharynx Esophagus Stomach Colon and Rectum Liver and Intrahepatic Bile Duct Pancreas Lung and Bronchus Melanoma of the Skin Breast (female cases only) Cervix Corpus and Uterus, NOS Ovary Prostate Testis Kidney and Renal Pelvis Urinary Bladder Brain and Other Nervous System Thyroid Hodgkin Lymphoma Non-Hodgkin Lymphoma Leukemia
Breakdowns by age and site The diverging trends between the overall population and younger adults is best understood through an analysis of specific cancer sites and age groups. Leading cancers by age and sex The cancer sites with the greatest impact on mortality and incidence vary considerably by age group (Figure 3A, Figure 3B). Among males, lung and bronchus cancer accounts for the highest share of cancer deaths in those over 55, while colorectal is the leading cancer cause of death at younger ages. For incidence, prostate cancer dominates in older males, while colorectal and testicular cancers are most prevalent among younger men. The pattern for females has some similarities. Lung and bronchus cancer is the top cancer cause of death in older women, while breast cancer leads at younger ages and is the overall leading cause of cancer incidence for females across all ages combined. Colorectal cancer is the second-leading cancer cause of death in women under 55.
Data and analysis The following outlines the data sources and analytical approach underlying this report, along with context for interpreting the findings. Death rates Age-adjusted death rates were calculated using death counts from the U.S. Centers for Disease Control and Prevention’s (CDC) National Vital Statistics System (NVSS) and population counts from the U.S. Census Bureau (USCB), standardized using the CDC 2000 standard population. Death data spans 1999–2025, with 2025 treated as provisional. Published USCB population counts were used through 2020, with estimates for 2020 onward from the USCB Vintage 2025 dataset. Cancer deaths were defined as those with an ICD-10 code of C00-C97 (the standard classification for malignant neoplasms). ICD-10 mappings for specific cancer sites can be found in the Appendix. Incidence rates Incidence rates were calculated using incidence and population counts from 2000 to 2023 from the Surveillance, Epidemiology, and End Results Program (SEER) across 21 registries, standardized using the CDC 2000 population table. For stage-of-diagnosis analysis, SEER’s own age-standardized rates were used directly. Throughout this paper, quoted annual changes in death rates reflect the slope of a standard linear regression fitted to age-standardized rates over the stated period, a more stable measure of trend than simply comparing start and end points in isolation. Additional considerations and limitations of the analysis are noted in the Appendix.
Total cancer mortality and incidence Much of the recent coverage on cancer trends has focused on rising incidence, specifically early-onset incidence. A key question remains: To what extent do rising rates of early-onset cancer reflect a true increase in underlying incidence? Answering this question requires considering a complementary metric: mortality. Treatment advances, changes in screening, and the varying survival rates of different cancer types all contribute to a complex array of factors and indicate that rising diagnoses do not automatically translate into rising deaths. [8] Mortality trends are encouraging: Between 2000 and 2025, overall cancer death rates fell 30% for females and 37% for males (Figure 1). This meaningful decline reflects decades of progress in treatment and prevention. On the incidence side, the picture is more mixed. Between 2000 and 2023, incidence rates increased 9% for females and declined 10% for males. But that male decline warrants a closer look: Most of it occurred between 2000 and 2014, after which rates stabilized and then began climbing again. Male cancer incidence rose 5% between 2014 and 2023 – a reversal that may reflect expanded screening activity, consistent with the long-term mortality improvements over the same period. [9] A noticeable dip in incidence for both males and females occurs in 2020, coinciding with the COVID-19 pandemic, potentially due to delays in screening (Figure 1).
For adults aged 25 to 44, the mortality story is more complicated. Mortality in 2025 remains significantly lower than in 2000, but the pace of improvement has slowed considerably. Between 2000 and 2018, cancer death rates for ages 25–44 declined roughly 1.8% per year for females and 2% per year for males. More recently, momentum has stalled: Between 2018 and 2025, the annual improvement for females shrank to 0.5%, while male death rates in this age group ticked upward by 0.2% per year (Figure 2). Incidence trends for this age group are even more striking. Between 2000 and 2023, cancer incidence rates among adults aged 25–44 rose 33% for females and 16% for males – increases that dwarf what was seen in the overall population.
Other risk factors and drivers No single risk factor explains these trends. The drivers behind changing cancer incidence and mortality are layered, sometimes interacting, and not all moving in the same direction. Additional risk factors and drivers include, but are not limited to: [16, 23, 29 - 32]
The picture is not uniformly negative. Tobacco use has declined significantly over decades, likely driving much of the sustained progress against lung and bronchus cancer. [42] Alcohol use has also dropped in recent years. [43] The prevalence of obesity and childhood obesity has increased over many decades, although developments such as GLP-1 drugs could begin to change that trajectory. [44] Other emerging risk factors are less understood. For example, recent evidence suggests a possible small increase in cancer associated with opioid use, although findings remain uncertain due to confounding and study limitations. [45] Looking ahead, advances in early cancer detection and treatment offer reasons for optimism. [46, 47] The USPSTF’s lowering of recommended screening ages for both colorectal and breast cancer – from 50 to 45 for colorectal, and from 50 to 40 for breast – expands the window for earlier detection. RGA’s Early-Onset Colorectal Cancer and Implications for the Life Insurance Industry details several recent technological advances that improve early detection options: [48] Fecal immunochemical test [49] CT colonography (virtual colonoscopy) Capsule endoscopy Blood-based biomarkers (liquid biopsy)[a] Multi-cancer early detection (MCED) liquid biopsy tests screen for multiple cancer types from a single blood draw. RGA has modeled what widespread MCED adoption could mean in practice. Projections suggest meaningful impacts on both cancer incidence and mortality over the next 20 years. Findings are explored in depth in RGA’s 2024 MCED report. [47, 50] Additional advances that may begin or continue to improve cancer detection and mortality outcomes include: [47, 51] HPV vaccine uptake [52] mRNA and other cancer vaccines [53, 54][b] Genomic screening for cancer likelihood Precision medicine for a personalized approach to optimal treatment Artificial intelligence for improved cancer detection (e.g., imaging and blood marker analysis) [50] Each of these advances carries its own timeline, uncertainties, and potential reach, but collectively they could have a meaningful impact. Insurer implications and considerations What do these trends mean for insurers? The implications span underwriting, product design, and customer engagement and are growing more relevant as the cancer landscape shifts. Screening encouragement, education, and wellness incentives: [7] Insurers have an opportunity to design products and services that encourage proactive screening through educational resources, financial incentives, and wellness programs that improve both customer outcomes and portfolio risk. Earlier detection may increase the volume of diagnoses in the near term, translating into higher upfront treatment costs as more cases are identified and managed - while ultimately reducing overall costs relative to later-stage detection. Undetected risk in younger applicants: Many adults under 50 are not up to date on screening or have not met the recommended screening age. [28] They may also have symptoms attributed to other diseases, resulting in delayed and later-stage diagnosis (e.g., misdiagnosing colorectal cancer as irritable bowel syndrome or hemorrhoids). [34] Later-stage diagnoses tend to carry worse clinical outcomes and may require more intensive treatment regimens, which can lead to higher treatment costs compared to cancers caught at earlier stages. [55] Anti-selection risk: [7] The growing availability of testing options – including at-home tests, MCEDs, and direct-to-consumer genetic screens – combined with accelerated underwriting, means that applicants may arrive with more knowledge about their own cancer risk than the underwriting process captures. Those with concerning results may disproportionately seek out certain products or insurers. More data, more complexity: [7] Electronic health records, wearable device data, and genetic screens create visibility into applicant health and lifestyle behaviors. However, these come with a variety of challenges around data security, regulatory compliance, and analytical capacity to interpret and act on the information responsibly. Cause-of-death analysis and trend monitoring: The evolving cancer landscape has many competing drivers moving at different speeds. Vigilant, ongoing monitoring of these trends and drivers is essential to accurately interpret impact. Taken together, these considerations reflect the broader complexity of cancer as a risk – one that continues to evolve and will benefit from ongoing monitoring and thoughtful assessment. Conclusion Cancer mortality in the U.S. has declined significantly over the past two decades, reflecting advances in prevention, detection, and treatment. Yet recent incidence and mortality data point to trends in transition. Improvements have slowed for younger adults, with rising incidence and notable increases in cancers such as colorectal and breast, alongside evidence of worsening outcomes in more recent birth cohorts. These patterns highlight that progress is uneven and that mortality gains may not fully capture emerging risks. Sustained progress will depend on closing screening gaps, addressing evolving risk factors, advancing treatment options, and leveraging new technologies. Insurers should remain vigilant in monitoring changing trends and their drivers. Cancer’s trajectory is shaped by many factors moving simultaneously and not always in the same direction. Understanding that complexity, and tracking how it evolves, is essential to navigating its implications effectively. RGA actively monitors cancer trends and drivers to provide clients with the biometric insights and insurance considerations they need to manage and price risk. FOOTNOTES: [a] According to the updated American Cancer Society guidelines in 2026, blood-based colorectal screening tests are not the preferred screening option at this time and are recommended only to those who decline or have not completed preferred screening measures. [27] [b] mRNA vaccines are not yet approved by the US Food and Drug Administration to treat cancer, but there have been trials investigating their potential.
Category Examples
Lifestyle factors tobacco use, alcohol consumption, Western diet, sedentary lifestyle
Medical factors obesity, childhood obesity, family history, antibiotic exposure and microbiome disruption, chronic health conditions (e.g., diabetes [33]), diagnostic delays or misdiagnosis of symptoms (particularly for younger patients) [34], public health interventions
Environmental exposures air pollution and other pollutions, infections, heavy metals, pesticides [35], microplastics [36], food and water contamination (e.g., nitrates, PFAS) [37, 38]
Socioeconomic disparities uneven access to care, differences in insurance coverage [39]
COVID-19 pandemic effects [40, 41] delayed diagnoses, potential of worsened outcomes
Considerations and limitations Cause-of-death and site classifications CDC mortality data (ICD-10, underlying cause of death) and SEER incidence data (ICD-O, tumor registry) use different coding systems and reporting practices. As a result, cancer site definitions are not always directly comparable across the two datasets. Harmonizing categories requires mapping and aggregation, which may involve some judgment and can vary across analyses. Mortality data is also subject to potential misclassification due to death certificate reporting and comorbidities, whereas incidence data can capture multiple primary cancers. This can lead to differences between incidence and mortality patterns for certain cancer types. While these are inherent limitations of working across two distinct coding systems, they do not materially affect the overall trends or conclusions presented in this paper. Age-standardization considerations The cancer death data extracted from CDC was grouped into 10-year age bands (rather than single-year ages) to limit data suppression. CDC suppresses counts below 10 for any given combination, which would significantly limit the availability of granular data. The cancer incidence data extracted from SEER was grouped into five-year age bands. As a result, age standardization was performed using these 10-year and five-year age groups for death and incidence rates, respectively. This introduces a limitation, as the age-adjusted rates are not fully standardized within each individual age band. For stage-of-diagnosis analysis, SEER’s own age-standardized incidence rates were used, which are standardized on single-year ages compared to five-year age bands used for other analyses in this report. While these methodological differences may result in minor variations in rate calculations, they do not materially affect the overall trends or conclusions presented in this paper. Population numbers For 2020 onward, population estimates were based on the USCB Vintage 2025 release, published in 2026. Vintage 2025 estimates provide population counts by age and sex for each year from 2020 to 2025. It is important to note that these estimates are provisional and subject to revision. The USCB updates population estimates annually through subsequent Vintage releases until the next U.S. Decennial Census results are available.
Mortality trends are encouraging: Between 2000 and 2025, overall cancer death rates fell 30% for females and 37% for males.
Between 2004 and 2023, distant colorectal cancer incidence rose 67% among adults under 50.
Perspectives from the RGA experts
U.S. mortality data perspectives
Underwriting: How US population death data helps us to understand the drivers of elevated mortality during the COVID-19 pandemic Catie Muccigrosso, VP & Chief Underwriter in USIL
Learn more
Research & Development: How US population mortality data helped us monitor the immediate and ongoing impacts of the COVID-19 pandemic Richard Russell, VP in Global Research and Development.
“As we emerge from the acute phase of the pandemic, our analyses of US population death data have helped us unpick the drivers of ongoing excess mortality. For instance, many individuals with SARS-CoV-2 infection have symptoms that persist far beyond the immediate phase of the disease, sometimes lasting for years after the initial acute illness. Research has shown that among individuals hospitalized for COVID-19, risk of death declined but remained significantly elevated in the third year after infection. Further, the 3-year burden of cardiovascular disease in hospitalized survivors of acute COVID-19 is also substantial; this likely helps to explain why increases in cardiovascular mortality rates – observed at the height of the COVID-19 pandemic – endured well into 2023, despite the end of the public health emergency.”
CLOSE
“Population death data is an essential asset for our Global R&D team. The highly detailed death data available on CDC WONDER is especially valuable given its volume and granularity. During the COVID-19 pandemic, the CDC WONDER data offered us a near real-time opportunity to monitor both the direct and indirect death toll of the pandemic; like many researchers, we observed that the full impact of the pandemic was much greater than what was suggested by deaths due to COVID-19 alone. Our research – using CDC WONDER data – has also helped us to estimate the proportion of excess mortality that was a direct result of a SARS-CoV-2 infection. To apportion excess deaths into those directly attributable to SARS-CoV-2 infection and those indirectly associated with the "ripple effects” of the pandemic, multiple drivers of cause-specific mortality – and changes in these during the pandemic period – need to be carefully examined. One example of a significant change in cause-specific mortality, in the pandemic period, is the decrease in influenza deaths seen in the first three months of 2021. Another example is the count of deaths due to cardiovascular disease (CVD) – this grew significantly in 2020, from 874,613 CVD-related deaths recorded in 2019 to 928,741 in 2020.”
VP & Managing Actuary, Assumptions Lead in USIL
A wide range of RGA experts – in underwriting, pricing, risk management, insurance medicine, research and development, and more – have derived insights from this data analysis that they have applied to insured (individual and group life) and annuitant populations. Brief summaries of these insights and their ongoing value to RGA’s work can be found below.
Individual Life Actuarial “While US individual life mortality is typically thought of as being much lower than general population mortality, population mortality can still help inform assumption setting for insureds in certain areas.” Susan Willeat VP and Managing Actuary, Assumptions Lead in US Individual Life
Group Life Actuarial “Given reporting lags associated with group life data, US population mortality data provides early insights into emerging trends in the group life market. Further, cause-of-death data at more granular breakdowns by age and gender are more credible in the larger US population dataset.” Michelle Haines Associate Actuary in US Group Re
Financial Solutions Actuarial “US population mortality experience can help us understand mortality trends and inform assumptions for pensioners.” Emily Dave Actuary in US Longevity Research
Insurance Medicine “US population cause-of-death data helps us to monitor how past and present medical advances have driven down mortality rates, and project how cause-specific mortality rates will evolve in future years.” Dr. Daniel Zimmerman SVP and Chief Science Advisor
Mortality TRENDS “US CDC population death data can serve as a high-quality leading indicator of where insured mortality improvement may be headed.” Jason McKinley Actuary in Global Research and Development
Insurance Risk “Insured population mortality and morbidity assumptions need to be set in the context of the wider general population. The trends and changes observed within the wider population provide insights into some of the dynamics that may filter through to the insured population.” Elena Tonkovski VP and Senior Actuary, Insurance Risk
UNDERWRITING “As we emerge from the acute phase of the pandemic, our analyses of US population death data have helped us unpick the drivers of ongoing excess mortality.” Catie Muccigrosso VP and Chief Underwriter in US Individual Life
GLOBAL R&D ”During the COVID-19 pandemic, the CDC data offered us a near real-time opportunity to monitor both the direct and indirect death toll of the pandemic; like many researchers, we observed that the full impact of the pandemic was much greater than what was suggested by deaths due to COVID-19 alone.” Richard Russell VP in Global Research and Development
As we emerge from the acute phase of the pandemic, our analyses of US population death data have helped us determine the drivers of mortality improvement. Mortality improvement among the general population was a historical trend before COVID-19 and is thankfully an overarching trend once again. While the insured population is only a subset of the general population, the same forces shaping mortality improvement impact both. Underwriters should carefully monitor mortality trends to ensure they are operating from a long-term risk perspective. The good news is that people are living longer. And for the life insurance industry, increased longevity creates greater need for the financial protection we provide: Longer lives mean more years to protect. We can meet that need by making products more accessible, engaging, and relevant – serving as partners in helping people lead long, fulfilling, and secure lives.
Actuary in U.S. Longevity Research
Given reporting lags associated with group life data, U.S. population mortality data provides early insights into emerging trends in the group life market. Further, cause-of-death data at more granular breakdowns by age and gender are more credible in the larger U.S. population dataset. That said, group life mortality is lower than mortality in the general population. The SOA’s 2024 Group Term Life Mortality Study shows that, across key working ages, insured mortality is approximately 30%–35% of population mortality. This differential is driven primarily by the actively-at-work requirement, which results in a healthier insured population. Population mortality trends can serve as a leading indicator of trends to monitor. Further, by analyzing population mortality by education level and adjusting for characteristics such as the education profile of the working population and the group life age- and sex-specific cause-of-death distribution, we can gain insight into the future direction of group life mortality.
While U.S. individual life mortality is typically thought of as being much lower than general population mortality, population mortality can still help inform assumption-setting for insureds in certain areas. One area is final expense, which generally serves a lower socioeconomic group very different from typical fully underwritten business. No current industry mortality table is even close to appropriate for final expense business. We have found that U.S. population tables provide the best baseline table for developing our internal mortality assumptions for final expense. Final Expense mortality increases relative to population as age decreases. The U.S. population baseline also provides useful perspective on the mortality for this unique market segment. U.S. population mortality is also helpful in setting mortality assumptions for very high attained ages. U.S. individual life mortality experience is clearly not as credible at very high attained ages as population experience. The question often arises: Will insured and population mortality eventually converge at some attained age? In other words, will the socioeconomic impacts that drive the difference between insured and population mortality disappear? One can use population mortality data split by a proxy for socioeconomic class to provide an indication of any convergence that could potentially inform assumption-setting at very high attained ages. By comparing the high attained age assumptions for each of our various market segments to a U.S. population basis, we can easily review them for consistency.
UNDERWRITING “As we emerge from the acute phase of the pandemic, our analyses of US population death data have helped us determine the drivers of mortality improvement.” Catie Muccigrosso Vice President and Chief Underwriter in U.S. Mortality Markets
GLOBAL R&D "Historical mortality experience is a critical starting point for setting forward-looking biometric assumptions." Richard Russell Vice President Biometric Research, Global Research and Development
Archives
Post-pandemic US Population Mortality: How to track it and why it matters
US Population All-Cause Mortality: Excess mortality declines to 0.4% in 2024
US Population All-Cause Mortality: Analysis by age and sex gives insight into reducing excess mortality
©2026, Reinsurance Group of America, Incorporated. All rights reserved. No part of this publication may be reproduced in any form without the prior permission of the publisher. For requests to reproduce in part or entirely, please contact: publications@rgare.com. RGA has made all reasonable efforts to ensure that the information provided in this publication is accurate at the time of inclusion and accepts no liability for any inaccuracies or omissions. None of the information or opinions contained in this publication should be construed as constituting medical advice.
Published September 2024
Published August 2025
Key takeaways In the current post-pandemic era, the observed short-term changes in population excess mortality are offering insight into medium-term and possibly longer-term changes. RGA has conducted an analysis of emerging US population mortality experience using three essential components: up-to-date death data from the CDC, population estimates from the US Census Bureau, and RGA developed pre-pandemic expectations of mortality against which the observed mortality can be compared and the excess calculated. US population mortality is a key source of granular and current mortality experience. Emerging US results may provide leading insights into mortality trends in insured lives applicable to multiple markets and multiple functions within an insurer.
Key takeaways
Ebrahim Steenkamp Data Scientist, Global Research and Development
Dan Brandt Vice President and Actuary, Experience Studies & Analytics, U.S. Individual Life
Michelle Haines Associate Actuary, Life, Accident and Worksite, U.S. Group Reinsurance
Jason McKinley Vice President and Actuary, Global Research and Development
Brendon Lapham Director, Data and Analytics Actuary, UK Pricing
Micah Canaday Vice President, Data Commercialization Global Data and Analytics
Richard Russell Vice President, Biometric Research, Global Research and Development
How to monitor US population mortality Monitoring emerging mortality experience requires three essential components: up-to-date death data, exposed-to-risk (exposure) data, and some expectation of mortality against which observed mortality can be measured. The US Centers for Disease Control and Prevention (CDC) National Center for Health Statistics (NCHS) provides authoritative US death data. Finalized death data through year-end 2022 is currently available from the CDC NCHS Vital Statistics Online Data Portal.2 Provisional and incomplete death counts are available from CDC NCHS’s mortality data via CDC’s Wide-Ranging ONLine Data for Epidemiologic Research (WONDER),3 the CDC portal for public health data, through the end of the prior week. Data are based on death certificates for US residents; each death certificate contains a single underlying cause of death, up to 20 multiple causes of death, and a myriad of demographic data. Death counts from CDC WONDER can be obtained pre-stratified by several variables, including place of residence (total US, region, state, and county), age group (including single-year-of-age cohorts), gender, date of death, place of death, and cause of death. Users must exercise care and judgment when using the latest mortality data from WONDER. (See “Considerations for death data” in this paper for more on this.) Raw death counts provide minimal value without exposure data. Exposure data must correspond to death data or be adjusted accordingly. The US Census Bureau (USCB),4 the official arbiter of national population numbers, provides both population estimates and projections, which can be used to develop exposure estimates. Alternative population estimates are available from other sources, but those estimates require careful review to ensure they correspond to the death data and cover all age ranges.
Understanding how current mortality has changed compared to pre-pandemic expectations requires an expected mortality basis, i.e., some form of expected mortality, against which to measure. Expected mortality is critical to determining excess mortality and its likely trajectory. (Considerations for expected mortality are explored later in this article.) Understanding changes in the drivers of mortality requires identifying underlying causes of death and breaking down expected mortality by cause. The cause definitions in the expected basis must align with the cause definitions in the death data to ensure they are comparable. This may sound obvious and straightforward, but anyone who has tried to reconcile causes of death across multiple International Classification of Disease (ICD) versions knows it is neither.
It is important to note that the USCB revises population estimates periodically as new data becomes available and methods are refined. Because of this, both population and exposure estimates can change, and results may change accordingly. By fall of 2024, the USCB expects to release the 2010 to 2020 Intercensal Estimates – the official population estimates for the 2010-2020 decade.
Considerations for death data Just as there are incurred but not reported/recorded (IBNR) claims in the insurance world, there are IBNR deaths in the death data from WONDER. The reason for this is that the death data from WONDER are provisional: It can take several weeks for death records to be submitted to the NCHS, processed, coded, and then tabulated. Consequently, provisional data may be incomplete, especially for more recent time periods. Death counts for the latest weeks are revised regularly, and may increase or decrease, as data from new and updated death certificates are received. Importantly, for recent periods, death counts in WONDER data are incomplete and not the counts that will ultimately be observed; the CDC does not gross up initial values for IBNR deaths to estimate where they might ultimately land, and such estimates are not readily available. Actuaries (and other like-minded professionals) can develop reasonable gross-up factors through relentless data collection and tracking how initial death counts progress over long time frames. Importantly, this data monitoring and later data interrogation allows the application of sensible confidence intervals to recent estimates. Estimating IBNR requires a deep understanding of how death data are reported.
Considerations for expected mortality Quality and robust expected mortality rates are critical for useful analyses. They will determine excess deaths where: Excess deaths = Reported deaths + IBNR deaths - Expected deaths The expected deaths are what, before the pandemic’s onset, would have been anticipated for the current period, but still allowing for improvements (and seasonality if needed). For interested readers, this section sets out considerations for setting expected mortality rates. A typical approach to setting expected mortality rates is to set base mortality rates, then overlay estimated and projected improvements, and then overlay seasonality adjustments if the analyses are at a monthly or weekly level. This approach is useful for setting expected rates for both all-cause mortality and specific causes of death. It is necessary to consider how to group different causes in the data when setting expected rates by cause; less significant causes of death have mortality rates too volatile to work within this type of analysis. Mortality improvements must also be included to allow for a realistic view of any excess mortality that needs to be understood and explained. This more complete view informs the insights drawn from even short-term mortality changes and trajectories. Figure 2: Improvements in all-cause mortality for males and females at ages 35 and 85 for 2011-2023
Reasons to monitor US population mortality US population mortality datasets are sizable and updated regularly. They contain granular details such as date of death, age at death, and cause of death information, and are readily and freely available. As the US records around 3 million deaths per annum, the data offers an advanced and credible perspective on short-term mortality. During the height of the COVID-19 pandemic, monitoring excess mortality in real-time provided a comprehensive view of the pandemic’s impact beyond confirmed COVID-19 deaths and a better understanding of the crisis’ true toll. The excess death data included deaths indirectly caused by pandemic-related factors, such as disruptions to healthcare systems and economic hardships, and the longer-term effects of COVID-19 infection. In the current post-pandemic era, the observed short-term changes in excess mortality are offering insight into medium-term and possibly longer-term changes. These insights can be used as inputs to create frameworks, principles, and approaches to set future mortality assumptions. They can also be used to validate outputs from the given frameworks and estimates provided by actuarial associations. Such insights have always been critical for pricing protection business and annuities but have become more important than ever as the industry emerges from the COVID-19 pandemic.
Deviations between actual and expected death rates – i.e., excess mortality – were massive during COVID-19’s acute phase. Since exiting that phase, excess mortality has lessened, and as COVID-19 is now endemic, the population has a greater level of inherent immunity against severe outcomes. Nevertheless, it is also clear that 2023 mortality remained elevated relative to the pre-pandemic mortality expectation when allowing for improvements and seasonality. The challenge now is to understand how, given COVID-19’s impact, mortality will transition in the short-to-medium term to its long-term level, and what this long-term level might be. Life insurers, public health officials, and actuaries across various domains are proposing frameworks, principles, and even estimates of future mortality. Their goal: to bridge the gap between how future mortality assumptions were set historically and how they could (or should) be set now that the acute phase has subsided. (See “UK Mortality Projections: Practical implications of CMI proposals” as an example.1) A review of the many proposals and counterproposals reveals uncertainty around future mortality trends over the short-to-medium term as the new mortality regimes settle in. RGA has conducted a thorough analysis of emerging US population mortality data to identify how US mortality has changed through the pandemic, determine what it looks like in 2023 and 2024, and to understand where it may be headed in the coming years. This introductory article explores the following: Reasons to monitor emerging US mortality Data elements required to do so Considerations for these data elements Resulting insights that might be translatable to insured life mortality
Introduction Analyzing historic mortality to support assumption setting for future mortality is a challenging task – one made more difficult in the wake of the acute phase, starting in March 2020 and ending in March 2022 – of the COVID-19 pandemic. Data from the last few years is clearly not a reliable predictor of future mortality, and actuaries can no longer steer assumptions by just looking in the rearview mirror. Figure 1 reflects the challenges of using recent mortality data.
* Expected mortality rates come from an RGA-developed expected basis that uses US population mortality data from 2011-2019 inclusive. Improvement trends and seasonality are allowed for in the basis. The basis includes projected mortality rates for the 2020-2024 period which incorporate, and project improvement trends seen in the data. This basis is referred to as the “pre-pandemic expectation.” ** The standard population data used is the “2000 US Standard Population (Census P25-1130),” available here: https://seer.cancer.gov/stdpopulations/stdpop.singleages.html
The graphs show the annual all-cause (log) crude mortality rates (dots joined by solid lines) by calendar month for lives aged 35 (left) and 85 (right) for both genders for the period 2011-2019 in the US. Smoothed curves are given by the dotted lines. Figure 4: Seasonality in “other accident” mortality for males and females at ages 35 and 85 for 2011-2019 The graphs show the annual (log) crude mortality rates (dots joined by solid lines) for the “other accident” cause of death by calendar month for lives aged 35 (left) and 85 (right) for both genders for the period 2011-2019 in the US. Smoothed curves are given by the dotted lines. The analyses that underlie the forthcoming full report use a pre-pandemic expected basis developed from the data described above. The expected bases are for all-cause and by-cause, and in all cases make allowances for improvement trends and seasonality. The improvements capture the trends observed in data and mortality rates are projected out for 2020 to 2024 with these trends. Extracting insured life insights Extracting insights for insured lives is a significant challenge when considering population-level mortality results. In many countries, for varied reasons, but notably underwriting, insured lives can have significantly different mortality levels from those of the general population. The differences in mortality among insured lives may also vary depending on the product and the provider. To translate population-level mortality insights into insured life insights requires a thorough understanding of a carrier’s book of business. Even then, appreciable uncertainty may remain and mandate the use of judgment. US population mortality data is a valuable data source. Challenges translating population-level insights to insured insights and to other countries are unavoidable given the US’s unique characteristics, such as its obesity epidemic, widespread opioid abuse, and lack of universal healthcare. That said, with the right data and approach, US population mortality can be a key source of granular and current mortality experience, and the emerging US results may provide leading insights into mortality trends in insured lives applicable to multiple markets.
By Brendon Lapham, Micah Canaday, Richard Russell, Jason McKinley, Michelle Haines, Dan Brandt, Ebrahim Steenkamp
Armstrong, C. (2023, April 24). Beyond the Pandemic: A driver-based view of mortality rates and their implications for actuaries. Beyond the Pandemic: A driver-based view of mortality rates and their implications for actuaries, RGA, Knowledge Centre. Retrieved April 24, 2024, from RGA Knowledge Centre: https://www.rgare.com/knowledge-center/article/beyond-the-pandemic-a-driver-based-view-of-mortality-rates-and-their-implications-for-actuaries https://www.cdc.gov/nchs/data_access/vitalstatsonline.htm https://wonder.cdc.gov/mcd.html https://www.census.gov/ https://www.soa.org/resources/research-reports/2023/rpec-mort-improvement-update/
RGA has conducted a thorough analysis of emerging US population mortality data to identify how US mortality has changed through the pandemic, determine what it looks like in 2023 and 2024, and to understand where it may be headed in the coming years.
Understanding how current mortality has changed compared to pre-pandemic expectations requires an expected mortality basis, i.e., some form of expected mortality, against which to measure. Expected mortality is critical to determining excess mortality and its likely trajectory.
To translate population-level mortality insights into insured life insights requires a thorough understanding of a carrier’s book of business. Even then, appreciable uncertainty may remain and mandate the use of judgment.
Figure 1: The four FIGO stages
The graphs show the (log) crude mortality rates (dots joined with solid lines) for all-cause mortality for lives age 35 (left) and 85 (right) by gender and calendar year for the period 2011-2023 in the U.S. The dotted lines show the linear trends for the period 2011-2019 extended through to 2023. Estimates from the Society of Actuaries’ Mortality Improvement Model could be used for all-cause mortality.5 But wherever or however derived, it is important to ensure that improvements are aligned with base mortality rates and the data used. Mortality improvements will also vary by cause. Setting by-cause improvement assumptions will require judgement and pragmatism where the death data is sparse. Death data from CDC WONDER is available at annual, monthly, and weekly resolutions. The analyses carried out by RGA use a monthly resolution. This requires including seasonality adjustments in the expected basis, as significant seasonality is frequently observed at monthly levels in the US. Seasonality varies by age and is most pronounced for older lives for all-cause mortality, as illustrated in Figure 3 for all-cause mortality. That said, seasonality can be observed for younger lives when mortality is broken down by cause. For example, Figure 4 shows crude mortality rates for “other accidents” (non-transport accidents) and reveals elevated mortality for younger lives in the summer months. Figure 3: Seasonality in all-cause mortality for males and females at ages 35 and 85 for 2011-2019
By Jason McKinley, Richard Russell, Brendon Lapham October 2024
Jason McKinley Actuary in Global Research and Development.
Dan Brandt Vice President & Actuary, Experience Studies & Analytics, U.S. Individual Life
Key takeaways US population mortality is a key source of granular and current mortality experience. Emerging US results may provide leading insights into mortality trends for insured lives applicable to multiple markets and multiple functions within an insurer. These population trends might also signal the time when insurers can safely and reasonably redevelop new mortality bases from insured data. US excess mortality estimates for 2020 (March-December) and 2021 were 21% and 20%, respectively. This excess dropped to 12% in 2022 and 4% in 2023. We expect US population excess mortality to settle in the region of 1%-3% for 2024 overall; however, there is material uncertainty to this estimate – for one, 2024 has months remaining as of this writing. An overall excess of 1%-3% would be appreciably lower than the excess of 4% observed in 2023. Importantly, we demonstrate that age and sometimes sex differences significantly impact US population excess mortality estimates. Introduction Our introductory article addressed the importance of monitoring population trends as a leading indicator of insured mortality in uncertain times.1 We stressed the importance of using the right data and methodology to develop sound conclusions. Here we look at mortality experience in recent years to compare actual mortality with pre-pandemic expectations. We include age and sex breakdowns to reveal material differences in emerging excess mortality by these factors, which is especially important in translating population-level insights into insured-life insights. We distinguish between COVID and non-COVID deaths in this analysis; future reports will explicitly tackle specific non-COVID causes. Expected mortality rates are derived from an RGA-developed expected basis that uses US population mortality data from 2011-2019 inclusive. Improvement trends and seasonality are allowed for in the basis. The basis includes projected mortality rates for the 2020-2024 period, which incorporate improvement trends seen in the 2011-2019 data. This basis is referred to as the “pre-pandemic expectation.” The results presented here use publicly available data from the US Centers for Disease Control and Prevention (CDC) and the US Census Bureau (USCB). The CDC and USCB regularly update this data, so results presented in this analysis may change as new data becomes available. CDC 2023 and 2024 death data are provisional, and 2024 has months remaining as of this writing. We developed proprietary incurred-but-not-reported (IBNR) values based on several years' worth of weekly CDC data submissions and have applied these in the “2024 Outlook” statements below. Data changes in the exposures, additions to deaths (as the provisional results are made final), and variability in how IBNR develops add material uncertainty to the estimates. Acute phase all-cause mortality Mortality throughout the acute phase (defined here as occurring from March 2020 through March 2022) of the pandemic was dramatically elevated. The US population saw age-adjusted death rates (AADRs) 20% higher than expected, representing more than 1.1 million excess deaths; see Figure 1. By calendar year, acute-phase excess mortality was 21% for 2020 (March-December), 20% for 2021 (January-December), and 20% for 2022 (January-March); see Table 1. For 2020, excess was consistent across age bands, but in 2021 and 2022, younger lives experienced a larger burden of the excess. This additional burden was most prominent in 2021, when the Delta variant became dominant and had a much greater relative impact on younger-life mortality. Deaths attributable to COVID-19, defined as having COVID-19 appear anywhere on the death certificate,2 were the main contributor (~84%) to excess deaths during the acute phase. Figure 1: Monthly actual and expected age adjusted death rates (AADRs) for all ages (0-100) by calendar month for the pre-pandemic period February 2018-February 2020, the acute phase (March 2020-March 2022), and the post-acute phase (April 2022-April 2024) of the pandemic.
The relationship between population and fully underwritten insured mortality prior to and during the peak of the pandemic was clearly delineated in the seminal life insurance experience reports developed by RGA, the SOA, LIMRA, and TAI. COVID-19 is identified as the cause of death if it is the underlying cause of death or if it was among multiple causes of death. This definition is used throughout this research.
Notes
Public health officials are reluctant to officially proclaim the pandemic over, which is understandable given the 25,000+ COVID-involved deaths in 2024 in the US (as of this writing). But the acute phase, when the country sometimes experienced that many excess deaths in one week, has passed. The post-acute phase remains in flux, and various drivers of mortality are impacting age groups differently and, importantly, in different ways than in the recent past. 2024 Outlook: A preliminary estimate for excess in 2024 (January through April only) is 1%, which is lower than the excess of 2% for the same period in 2023, suggesting that excess mortality has continued to decrease in 2024; see Figure 2 and Figure 3. We expect overall US population excess mortality to settle somewhere higher than 1% by the end of 2024 — perhaps in the range of 1%-3% for 2024 in total, mainly due to the recent phenomenon of a shift forward in winter seasonal deaths among older lives. As noted earlier, there is sizeable uncertainty in this estimate, given CDC 2024 death data are provisional, and 2024 has months remaining as of this writing. Figure 2: Monthly actual and expected AADRs for ages 25-100 for females and males. The period shown is January 2015 to April 2024.
The post-acute phase of the COVID-19 pandemic remains in flux, and various drivers of mortality are impacting age groups differently and, importantly, in different ways than in the recent past.
Emerging US results may provide leading insights into mortality trends for insured lives applicable to multiple markets and multiple functions within an insurer.
Table 1: Age-adjusted excess mortality (actual AADR/expected AADR - 1) by sex, age band, and calendar year.
Figure 3: Total excess deaths (reported deaths + IBNR deaths – expected deaths) and reported COVID-involved deaths by month for ages 25-100 for females and males. The period shown is March 2020 to April 2024.
To understand where population excess mortality may be headed in the medium term, a comprehensive evaluation of each major cause of death is essential. We will examine some of the trends in specific causes in subsequent reports.
Ages 25 to 44 The US opioid epidemic predates the COVID-19 pandemic and continues today. Drug overdose deaths are most prevalent among the younger population. The historic rise in drug overdose deaths has translated to a negative improvement trend in population all-cause mortality at ages under 45 in the years leading up to the pandemic (2011-2019), which only worsened during the pandemic’s acute phase; see Figure 4. The negative trend did not discriminate by sex: The all-cause male annual dis-improvement rate was approximately 3.2% from 2011 to 2019 (the CDC officially declared the overdose crisis to be an epidemic in 2011), while female dis-improvement was approximately 2.1% per annum in that time frame. While the COVID pandemic provided additional headwinds in 2020 and beyond, COVID itself contributed much less to this group’s excess than the sum of all other causes; see Figure 5. Mortality in this age range peaked during the Delta wave of 2021, but for the first time in years in the US, this group appears headed toward three straight years of positive improvement. This welcome development may be largely attributable to an easing of mortality from drug overdoses. Indeed, the CDC recently reported that 2023 saw the first annual decrease in drug overdose deaths, across all ages, since 2018. Note: RGA’s US population mortality analysis will address this topic in greater detail as we explore specific causes of death in subsequent reports. Figure 4: Actual and expected AADRs for ages 25-44 for females and males. The period shown is January 2015 to April 2024.
Figure 5: Total excess deaths and reported COVID-involved deaths by month for ages 25-44 for females and males. The period shown is March 2020 to April 2024.
2024 Outlook: This age group has a large proportion of non-medical deaths. Non-medical deaths take many months longer to have a cause of death assigned. Our IBNR adjustments work best when cause of death information is available so the magnitude of excess for 2024 overall – in this age group – is still highly uncertain. That said, indications are that the 2024 age-standardized mortality will continue its drop since the 2021 peak. That is a remarkable turnaround, considering the previous trend and the worse-than-trend peak during the pandemic’s acute phase. Ages 45 to 59 For the decade preceding the pandemic, people aged 45 to 59 in the US experienced consistent cancer mortality improvements, which were countered by negative cardiovascular experience and increasing overdose deaths, resulting in largely stagnant improvements overall for most of the decade; see Figure 6. The trend of minimal year-to-year variance in the age-standardized all-cause mortality held steady from 2011 to 2019. The pandemic disrupted that trend beginning in 2020, but causes of death in addition to COVID contributed to the excess; see Figure 7. During the acute phase, this age group suffered particularly from a combination of metabolic disease deaths and increased cardiovascular deaths. In the post-acute phase, cardiovascular deaths have continued at a slower pace, but the suite of metabolic diseases has remained problematic, along with elevated cancer deaths. As of this writing, cancer and metabolic diseases are contributing more to the excess in this age group than COVID is. One tailwind for mortality in this and older age groups is the seeming displacement of pulmonary deaths, largely chronic obstructive pulmonary disease, that has been prevalent since the start of the pandemic. Figure 6: Actual and expected AADRs for ages 45-59 for females and males. The period shown is January 2015 to April 2024.
Figure 7: Total excess deaths and reported COVID-involved deaths by month for ages 45-59 for females and males. The period shown is March 2020 to April 2024.
2024 Outlook: Although still within the CDC provisional death data reporting period, the 2024 outlook is for excess to persist in this age group and possibly end the year between 3% and 5%. The predictability of this group pre-pandemic meant that projecting any excess over 1% would have been unusual, so projecting upward of 3% is unprecedented. Seasonality does not typically affect this age group as much as it affects older ages, so we do not expect an unusual end-of-year scenario moving that estimate much higher. Ages 60 to 74 Entering the pandemic, female mortality improvement was mildly positive (about 0.5% per annum) and male improvement was quite flat for this age group; see Figure 8. While males and females experienced similar excess mortality impacts during the acute phase of the pandemic, males have been returning to pre-pandemic expectations more quickly than females. Much of this difference is due to male cardiovascular deaths moving closer to pre-pandemic expected levels in 2023, while female cardiovascular deaths remained elevated. Female cancer excess also outpaces male cancer excess. COVID accounts for the largest share of excess in this age group, a situation that becomes increasingly prevalent with older ages; see Figure 9. Negative non-COVID excess has remained similar to that of the acute phase but is not as significantly offset by the positive excesses (COVID, etc.). Figure 8: Actual and expected AADRs for ages 60-74 for females and males. The period shown is January 2015 to April 2024.
Figure 9: Total excess deaths and reported COVID-involved deaths by month for ages 60-74 for females and males. The period shown is March 2020 to April 2024.
2024 Outlook: Males in this age group could return to pre-pandemic expectations in 2024. The good non-COVID experience seems to be largely offsetting the COVID deaths for males. The female outlook is not quite as positive. Males have a chance to record a better mortality rate than any they experienced in 2011 through 2019. Females accomplishing the same would require some extremely good results in the final few months of the year. More likely, males will end up within approximately 1%-2% of pre-pandemic expectation, with females over 2% higher. Ages 75 to 84 Almost all mortality trends for ages 60 to 74 apply to ages 75 to 84 as well, with the exceptions of the pre-pandemic annual improvement rates (around 0.8% for males and females) and some manifestations of causes of death over the acute and later pandemic phases; see Figure 10. In this age group, COVID has driven almost all excess mortality since the pandemic began; see Figure 11. The post-acute phase has seen a continuance of good experience from non-COVID excess as COVID itself has subsided. But for females in particular, the evidence of an uptick of cancer deaths has added to the all-cause story. Figure 10: Actual and expected AADRs for ages 75-84 for females and males. The period shown is January 2015 to April 2024.
Figure 11: Total excess deaths and reported COVID-involved deaths by month for ages 75-84 for females and males. The period shown is March 2020 to April 2024.
2024 Outlook: As with the 65-to-74 age group, males have a realistic opportunity to return to pre-pandemic mortality rates in 2024. Given the likely negative impact of seasonality, the more prudent forecast would anticipate slightly elevated male mortality, between 1% and 2%. For females, the outlook is slightly worse, with cancer remaining elevated above the very good pre-pandemic expectations. Ages 85 and Older For ages 85 and older, the pre-pandemic period was one of great mortality improvement – around 1.4% per year; see Figure 12. The pandemic impacted mortality for this age group the most, as advanced age often brings comorbidities and a limited ability to fight off intense infections. Cardiovascular deaths increased for this group, as did many other medical causes of death to a lesser extent. The only consistent bright spot was a decline in pulmonary deaths, likely displaced by COVID. This age group experienced three instances where excess deaths in one or more consecutive months topped 25%. Each of those instances was followed by a two-to-four-month period when all-cause experience was far better than the COVID mortality alone would dictate; see Figure 13. This may indicate accelerated deaths due to COVID that had a relatively immediate impact on the non-COVID causes in the aftermath of a large wave of COVID deaths. Figure 12: Actual and expected AADRs for ages 85 and older for females and males. The period shown is January 2015 to April 2024.
Figure 13: Total excess deaths and reported COVID-involved deaths by month for ages 85 and older for females and males. The period shown is March 2020 to April 2024.
2024 Outlook: COVID deaths hit this age group the hardest. That was true during the pandemic and remains true now, although the mortality impact has greatly diminished. As in the acute phase, COVID still appears to accelerate and displace deaths in this group, contributing to the non-COVID excess being generally quite good. Even cardiovascular deaths are approaching pre-pandemic expectations. But with flu season now underway, combined with the recent phenomenon of the seasonal increase in mortality for this age group starting earlier than expected (see Figure 12), we expect death rates in this group to remain a good deal higher than pre-pandemic expectations in 2024 – possibly around 2%-4% higher when the official statistics are available. What’s next RGA will continue to monitor US population mortality using the best data available and in near-real time, incorporating updates weekly and liaising with experts from the CDC, the USCB, and demographers as necessary. The results of this analysis are subject to change as new data becomes available. We have taken steps to reduce the likely impact of these changes, e.g., by including IBNR. In addition, this analysis combines multiple series of population estimates from the USCB, which requires incorporating adjustments to ensure smooth transitions across the different series. An upcoming change worth noting is the USCB’s release of the 2010 to 2020 Intercensal Estimates, with total figures slated for fall 2024 and age and sex breakdowns in late 2025. To understand where population excess mortality may be headed in the medium term, a comprehensive evaluation of each major cause of death is essential. We will examine some of the trends in specific causes in subsequent reports. To learn about the latest all-cause and by-cause report updates as they are published, sign up for RGA’s US mortality analysis email list.
Emerging all-cause mortality
Brendon Lapham Director, Data & Analytics Actuary, UK Pricing
Richard Russell Vice President, HBiometric Research, Global Research and Development
In brief In the wake of the COVID-19 pandemic, RGA has conducted a thorough analysis of emerging US population data to explore how all-cause mortality and excess mortality have changed through the pandemic, determine what they look like in the short term, and understand where they may be headed. While we have observed persistent excess mortality in the US population following the acute phase of the COVID-19 pandemic, recent mortality trends – including 2024 excess death estimates – suggest that the overall excess has decreased substantially from the peak of the acute phase. Indeed, there is a possibility that the age-standardized mortality – for some age groups and sometimes depending on sex – will be lower in 2024 overall than that observed in 2019 and in-line with pre-pandemic expectations for the period.
By Richard Russell, Jason McKinley, Brendon Lapham August 2025
Key takeaways US population mortality is a key source of granular and current mortality experience. Emerging US results may provide leading insights into mortality trends for insured lives applicable to multiple markets and multiple functions within an insurer. These population trends might also signal the time when insurers can confidently and reasonably redevelop new mortality bases from insured data. Using an updated US population expected basis, we approximate that US excess mortality in 2024 was 0.4%, a significant reduction from the 3.2% estimated in 2023. Age and sex differences significantly impact US population excess mortality estimates. The 2023-2024 and 2024-2025 flu seasons had diminished impacts on 2024 mortality, with peaks occurring in late 2023 and early 2025, respectively; this helped drive down overall excess mortality in 2024. Introduction Our previous report presented US mortality experience in years 2020-2023, comparing actual mortality with pre-pandemic expectations. We also included “2024 outlook” statements suggesting where we expected overall US population excess mortality to settle by the end of that year. Here we review full-year 2024 excess mortality, including age and sex breakdowns, while separating COVID-19 and non-COVID-19 deaths. Expected mortality rates are derived from an RGA-developed expected basis that uses US population mortality data from 2011-2019 inclusive. The baseline for comparison is a key assumption when calculating excess deaths. Expected mortality rates can be produced in numerous ways and will determine the excess results derived – read more about this in our introductory report. In this current report, we have revised the expected basis, providing an updated assessment of the excess deaths that have occurred. The prior basis included projected mortality rates for the 2020-2024 period and incorporated seasonality and improvement trends observed in the 2011-2019 data. March 2025 marked five years since the pandemic officially began. It is questionable whether estimates of excess mortality based on extrapolations of pre-pandemic mortality trends remain sensible over such an extended period. Consequently, we now include age- and sex-specific long-term rates (LTRs) of mortality improvement, reached after age- and sex-specific convergence periods, in the expected basis. LTRs were derived using average annual improvements observed in the US from 1933 to 2023; mortality rates were taken from the Human Mortality Database. While the expected basis again includes seasonality and begins with the trends supported by the 2011-2019 data, expected mortality rates now converge toward LTRs. One additional, important update to the basis is our incorporation of the US Census Bureau’s (USCB’s) 2010-2020 intercensal population estimates, which were released in late 2024. The results presented here use publicly available data from the US Centers for Disease Control and Prevention (CDC) and the USCB. The CDC and the USCB regularly update this data, and results presented in this analysis may change as new data becomes available.
Figures 2 and 3 clearly illustrate that – for ages 25-100 – all-cause AADRs and COVID-19 deaths continued to decline in 2024, resulting in a substantial decrease in excess mortality. In our last report, we suggested that excess mortality might settle in the range of 1%-3% for 2024 in total, mainly due to the recent shift forward in winter seasonal deaths among older lives. However, the 2023-2024 and 2024-2025 flu seasons had diminished impacts on 2024 mortality as they peaked in late 2023 and early 2025, respectively; this helped drive down excess mortality in 2024.
These population trends might also signal the time when insurers can confidently and reasonably redevelop new mortality bases from insured data.
Ages 25 to 44 Mortality trends among early adults in the US were recently reported by Wrigley-Field et al.; as in our report, the researchers showed that mortality rates in early adulthood (ages 25-44 years) have risen substantially in two stages: 2011-2019 and 2020-2023; see Figure 4. From 2011 to 2019, we estimate that all-cause male annual dis-improvement was approximately 3.2%, while female dis-improvement was approximately 2.1% per annum. A significant rise in drug overdose deaths in this period helped fuel a large increase in all-cause mortality for this age group. The rise only worsened during the pandemic’s acute phase. As predicted in our previous report, this age group has now achieved three straight years of improvement. A clear and obvious decline in mortality rates started after the acute phase of the pandemic; however, excess mortality remained higher than expected based on pre-pandemic levels in 2023. Using an updated expected basis, we estimate that 2023 excess mortality was 7.1% in females and 11.0% in males. These estimates are higher than we previously reported due to the convergence to LTRs in our existing expected basis. The research by Wrigley-Field et al. indicated that the largest fraction of 2023 excess mortality was due to drug poisoning, but many other external and natural causes of death surpassed what historic trends would have projected. COVID-19 itself contributed much less to this group’s excess than the sum of all other causes; see Figure 5.
2024 excess: Remarkably, 2024 AADRs in this age group nearly returned to 2019 levels for men and women. This is an astonishing recovery, considering the 2020-2023 trend, with significant year-on-year dis-improvements. Indeed, using the updated expected basis, we estimate that 2024 excess mortality ran negative: -1.9% in females and -1.7% in males. There remains a long way to go for this group to achieve what could be considered favorable mortality, but the 2024 result is a basis for cautious optimism. Ages 45 to 59 From 2011 to 2019, AADRs in this age group were quite flat. The pandemic disrupted this trend; see Figure 6. During the acute phase of the pandemic, 45-to-59-year-olds suffered increased cardiovascular and metabolic disease deaths; research studies indicate that the pandemic exacerbated existing health issues, leading to more severe cases and higher mortality rates in individuals with these pre-existing conditions. Emerging from the public health emergency, excess cardiovascular deaths have continued at a slower pace while metabolic diseases have remained elevated, along with cancer deaths. In 2023, excess mortality was 5.8% for females and 9.6% for males; non-COVID-19 causes of death make up most of the excess, especially in males; see Figure 7.
2024 excess: Excess mortality in 2024 remained sizeable in this age group: 2.5% in females and 4.0% in males. COVID-19 was only a small contributor to the observed excess, with cancer and metabolic diseases being the most important drivers Ages 60 to 74 The 60-to-74-year-old cohort is a significant segment of the overall US population, often referred to as the “young-old” within the broader category of older adults. Recently published USCB data shows that, as the US population continued to age, the share of the population aged 65 and older increased from 12.4% in 2004 to 18.0% in 2024. Mortality improvements, 2011-2019, have been minimal for this age group. AADRs have followed a strikingly comparable pattern for females and males in the period 2015-2024; see Figure 8. Furthermore, the pattern of excess mortality experienced between females and males is most similar in this age group compared to other age groups; see Figure 9. Using our updated expected basis – with the inclusion of LTRs – reveals that the excess mortality estimate for males increased in 2023; our latest estimates of 2023 excess mortality are 5.2% for females and 4.5% for males.
2024 excess: Excess mortality in 2024 continues to be significant in this age group: 3.9% in females and 2.6% in males. On the other hand, 2024 AADRs in this age group are very close to pre-pandemic levels for both men and women. Ages 75 to 84 The leading causes of death for this age group are very similar to the 60-74 age group, although pre-pandemic annual improvement rates have been higher in 75–84-year-olds. In the period 2011-2019, per annum improvements in AADRs were 0.8% for males and females; see Figure 10. In this age group, COVID-19 has driven almost all excess mortality since the pandemic began; see Figure 11. Adjustments to the expected basis have had minimal impact on our previously reported excess mortality estimates. In 2023, excess mortality was 2.6% for females and 0.7% for males. The post-acute phase has seen a continuance of good experience from non-COVID-19 causes of death while COVID-19 mortality has slowly subsided; see Figure 11.
2024 excess: Excess mortality in 2024 was quite different by sex: 1.5% in females and -0.8% in males. Minimal mortality burden from the past two flu seasons helped drive down excess mortality. Importantly, 2024 AADRs – in both men and women – are at levels lower than observed pre-pandemic. COVID-19 continues to be an important factor. The higher excess in females relative to males appears to be a consequence of a material rise in cancer deaths; modeling studies support the hypothesis that declines in breast cancer screening and diagnosis during the pandemic could have material impact on cancer mortality in this timeframe. Ages 85 and Older Incorporating the USCB’s latest population estimates in our expected basis has had a material impact on the excess results for this age group. This is due to a significant change to our population exposure estimates in persons aged 85 and older. Prior to the pandemic, this age group experienced substantial mortality improvement – around 1.4% per year in the period 2011-2019; see Figure 12. This age group was the most vulnerable to COVID-19; according to the CDC, the death rate for COVID-19 among adults aged 85 and over (1,645.0 per 100,000 population) was 2.8 times higher than the rate for ages 75–84 (589.8), and seven times higher than that for ages 65–74 (234.3) in 2020. While COVID-19 mortality rates in this age group decreased significantly over the course of the pandemic, they remained higher in 2023 than those for all other age groups. As in the acute phase, COVID-19 still appears to somewhat accelerate and displace deaths in this group, as indicated by the peaks in COVID-19 deaths followed by troughs in total excess deaths; see Figure 13. Using our updated expected basis, we now report significantly different estimates of 2023 excess mortality: 1.4% in females and -2.3% in males. These estimates are much lower than our previous figures, given that we now reflect updates to the USCB’s population estimates as well as convergence to LTRs.
2024 excess: Older adults, especially those aged 85+, are at a significantly higher risk of severe complications and death from influenza. Seasonal influenza’s impact on all-cause mortality varies from year to year, with more severe seasons leading to higher mortality rates. The 2024-2025 influenza season in the US has been classified as “high severity” – the first high-severity designation since the 2017-2018 season. Our previous report suggested that, due to concerns around the mortality burden of the 2024-2025 flu season, excess mortality and AADRs in this age group might remain higher than pre-pandemic expectations in 2024. The 2023-2024 and 2024-2025 flu seasons had diminished impacts on 2024 mortality in this age group, as they peaked in late 2023 and early 2025, respectively. This has certainly eased overall excess mortality in 2024. AADRs have returned to pre-pandemic levels for both men and women. Indeed, male AADRs are the lowest we have ever observed. Consequently, our excess mortality estimates for 2024 are: -0.2% in females and -4.9% in males. What’s next RGA will continue to monitor US population mortality using the best data available and in near-real time, incorporating updates weekly and liaising with experts from the CDC, the USCB, and demographers as necessary. The results of this analysis are subject to change as new data becomes available. To understand where population excess mortality may be headed in the medium term, a comprehensive evaluation of each major cause of death is essential. We will examine some of the trends for specific causes in subsequent reports. To learn about the latest all-cause and by-cause report updates as they are published, sign up for RGA’s US mortality analysis email list.
All-cause mortality trends by age and sex
In brief Excess mortality during the COVID-19 pandemic has been considerable. Understanding excess death rates in the aftermath of the global public health emergency remains essential to assess its lingering burden. In this report, RGA has updated its analysis of US population data to understand how all-cause excess mortality settled in 2024, the fifth year of COVID-19. While we have observed persistent excess mortality in the US population following the acute phase of the COVID-19 pandemic, recent mortality trends suggest that all-cause mortality rates have continued to decrease substantially, with 2024 total excess mortality settling at just 0.4%. Minimal mortality burden from the past two flu seasons – impacting the 2024 calendar year – helped drive down excess mortality. Age and sex differences significantly impact US population excess mortality estimates, which suggests the underlying drivers of persistent excess mortality vary based on these factors. To understand where population excess mortality may be headed in the medium term, a comprehensive evaluation of each major cause of death is essential. RGA will examine some of the trends in specific causes in subsequent reports.
A return to widespread mortality improvements is a welcome sign after so much loss of life during the acute phase of the COVID-19 pandemic. Yet even this good news brings its own challenges. With life expectancy again on the rise, the risk of people outliving their savings increases accordingly, creating financial pressure for both individuals and governments. Insurance protection is essential to help fill the gap. In a recent Fortune interview, RGA President and Chief Executive Officer Tony Cheng outlines the industry’s vital role in ensuring long-term financial security and the need to educate the public on the benefits of insurance in retirement:
“On the longevity side what [longer lifespans] could unearth—which I believe one day will happen—is the consumer’s stronger awareness that unfortunately people may outlive their savings. And that’s scary.” This realization will also likely come “quite slowly” and “probably too late”, Cheng added: “If government budgets get more stretched—the amount you can get from the government one would think it’s going to be less over time, hence the need for more private funding.” “So that realization is an insurance gap, what I would call longevity insurance gap, that we educate on but people [would] rather take a lump sum usually than get paid a pension for the rest of their life. That’s a human trait.” He continued: “The government has to educate, the consumers actually have to listen and be educated. And then the business is obviously the big engine that gets it going.”
With decades of experience enabling insurers to provide life, health, and longevity protection, RGA is ready to help your business get up to speed to meet evolving consumer needs. Contact us today.
Filling the longevity insurance gap
In a recent Fortune interview, RGA President and Chief Executive Officer Tony Cheng outlines insurance’s vital role in ensuring financial security for longer lifespans.
All-cause mortality by period US population age-adjusted death rates (AADRs) by pandemic period are shown in Figure 1. By calendar year, acute-phase excess mortality was 21.0% for 2020 (March-December), 18.8% for 2021, 11.3% for 2022, 3.2% for 2023, and 0.4% for 2024; see Table 1. Note: Some excess estimates are different than those published in our previous report, given the changes to the expected basis as described above.